Figure 5.
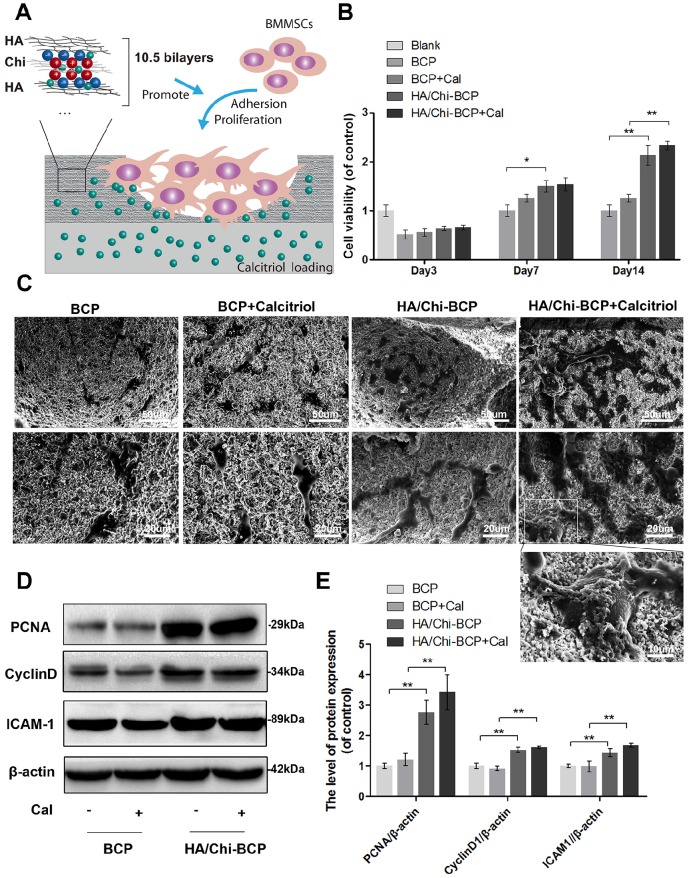
Effects of different scaffolds on OVX-rBMSCs proliferation and adhesion. (A) Schematic illustration of the effects of porous HA/Chi film on cell proliferation and adhesion. (B) Cell viability on various scaffolds tested using the CCK-8 assay. (C) SEM images of the morphology of OVX-rBMSCs on different scaffolds at day 14 (scale bars: 50, 20, and 10 μm). (D-E) Representative western blot results and quantification data for PCNA, cyclin D1, and ICAM-1. Data are presented as the mean ± S.D. Significant differences among scaffold groups are indicated as ** P < 0.01, * P < 0.05, n = 5.

