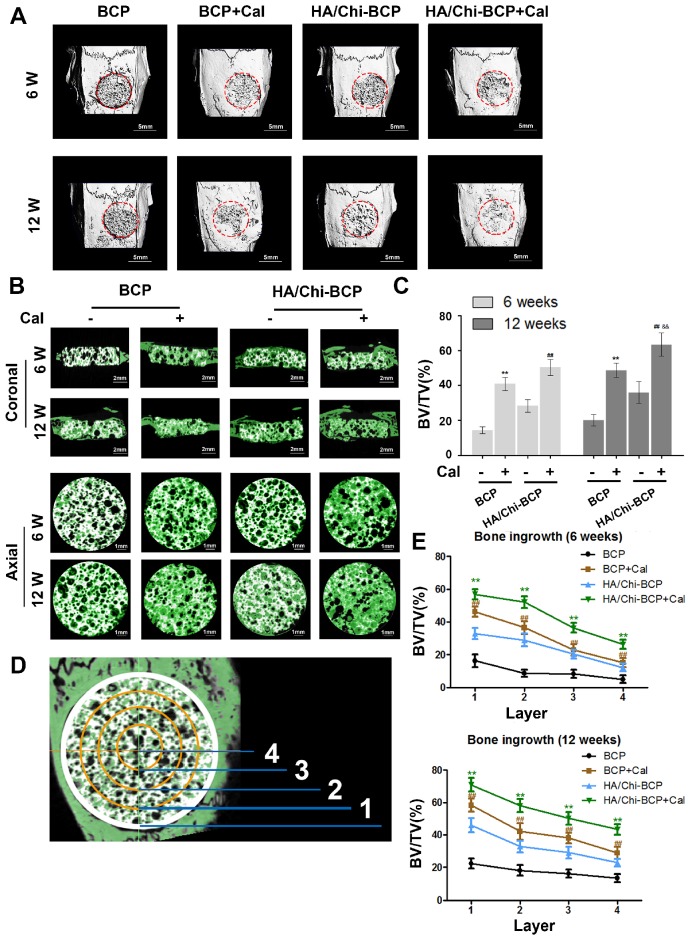
Figure 7.
Micro-CT analysis of the effects of various BCP scaffolds on new bone formation in the critical-size bone defect model of OVX rats. (A) Three-dimensional reconstruction of micro-CT images of the various scaffolds implanted in the rat calvarium at 6 and 12 weeks (scale bars: 5 mm). (B) Two-dimensional reconstruction of micro-CT images of various scaffolds implanted in the rat calvarium at 6 and 12 weeks (the white colour component shows the remaining scaffold, bone that grew around and into the scaffolds is labelled in green) (scale bars: 2 mm for coronal images and 1 mm for axial images). (C) Regenerated bone volumes on the various scaffolds were quantified as bone volume divided by total volume (BV/TV). (D) General sketch of the scaffold, which was divided into four layers. (E) Percentages of bone volume regenerated into the scaffold in different layers from the edge to the centre. Data are presented as the mean ± S.D. Significant differences among scaffold groups are indicated as ** P < 0.01, * P < 0.05, compared with BCP; ## P < 0.01, # P < 0.05 compared with HA/Chi-BCP, and && P < 0.01, & P < 0.05 compared with BCP+Cal; for each group, n = 5.

