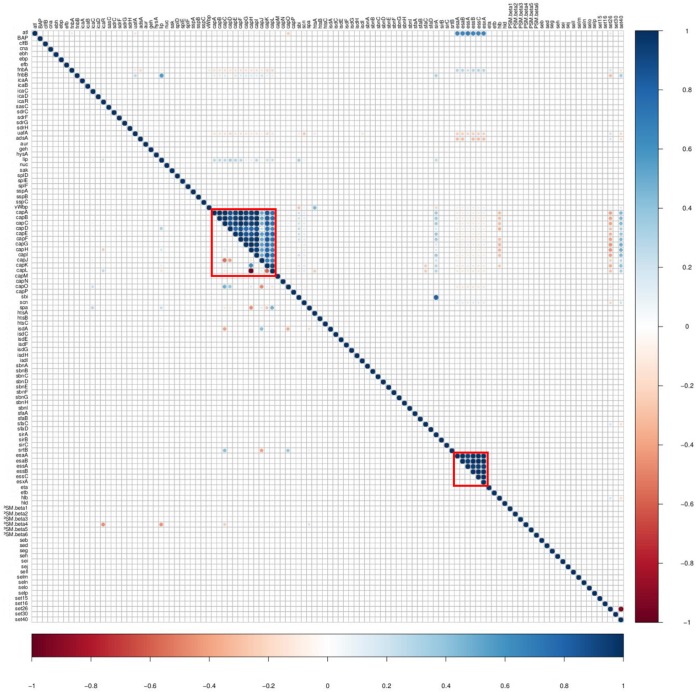
FIG 10.
Comparison of pairwise associations between Staphylococcus chromogenes and Staphylococcus simulans. Mirror image showing differences in VF associations between two NAS species. The top right triangle shows the pairwise associations of virulence genes identified in Staphylococcus chromogenes. The bottom left triangle represents associations of virulence genes detected in Staphylococcus simulans. The distinctive associations between two species are marked with red boxes. The associations were computed using the phi coefficients (143). Colors represent the type of association (blue for positive; red for negative), while the intensity of the color and the size of the circle show the strength of the correlation.

