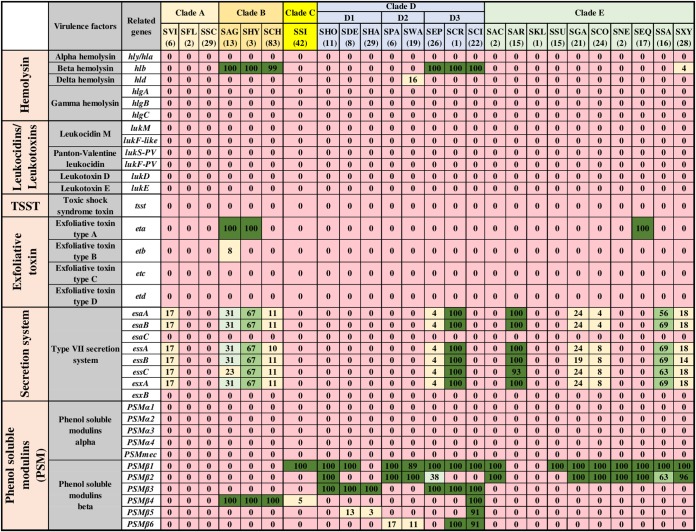
FIG 5.
Distributions of toxin genes of different categories. Distribution of 36 toxin genes of 25 NAS species, arranged into five clades (A, B, C, D, and E) according to their placement in phylogenetic trees (32). Values and different colors within cells represent the percentage of isolates containing a given gene. The color gradient from red to dark green indicates increasing percentage of isolates containing the particular gene within species (light yellow, 1 to 25% of isolates; light blue, 26 to 50% of isolates; light green, 51 to 75% of isolates; dark green, 76 to 100% of isolates).

