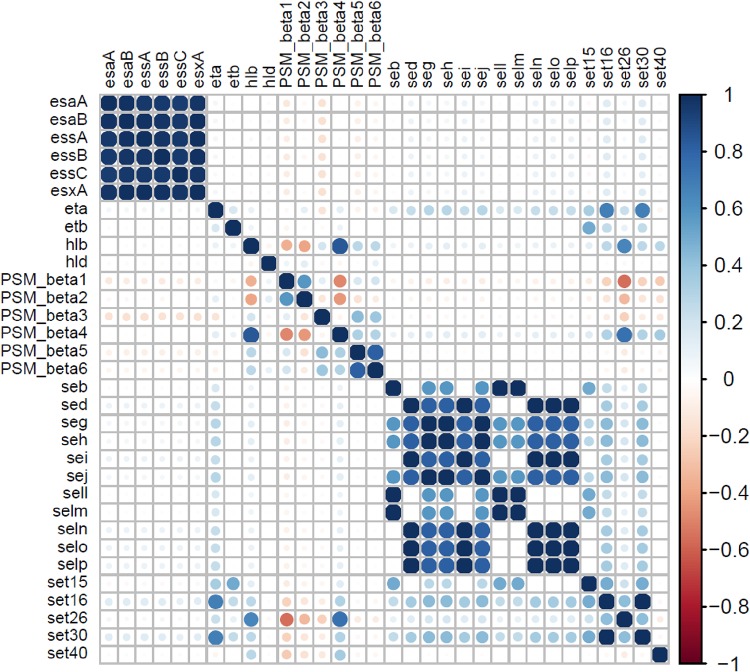
FIG 7.
Pairwise associations of toxin genes. Pairwise associations of toxin genes, computed using the phi coefficient (143). Colors represent the type of association (blue for positive; red for negative), while the intensity of the color and the size of the circle show the strength of the correlation.

