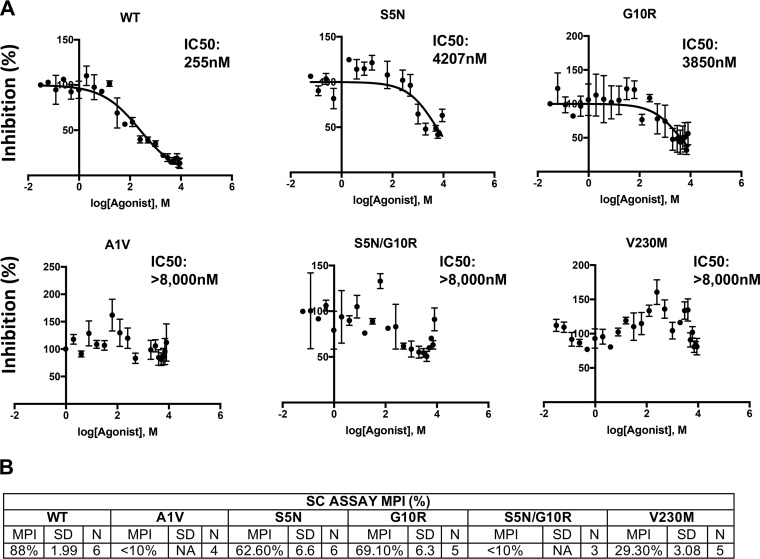
FIG 9.
Quantitative assessment of MI resistance conferred by CA-V230M, SP1-A1V, S5N, G10R, and S5N/G10R. 293T cells were transfected with WT or mutant molecular clones, and the transfected cells were treated with 22 concentrations of compound 7r between 0 and 8 μM (see Materials and Methods). Virus-containing supernatants were harvested, normalized for RT activity, and used to infect TZM-bl cells. Infectivity data were analyzed with GraphPad Prism 7 for Mac OS X from 3 to 5 independent experiments, as described in the Fig. 6 legend and Materials and Methods. (A) Data from one representative experiment. (B) Maximum percent inhibition (MPI) calculated from the single-cycle (SC) assays as described in the Fig. 6 legend. The SD is indicated (n = 3 to 5).

