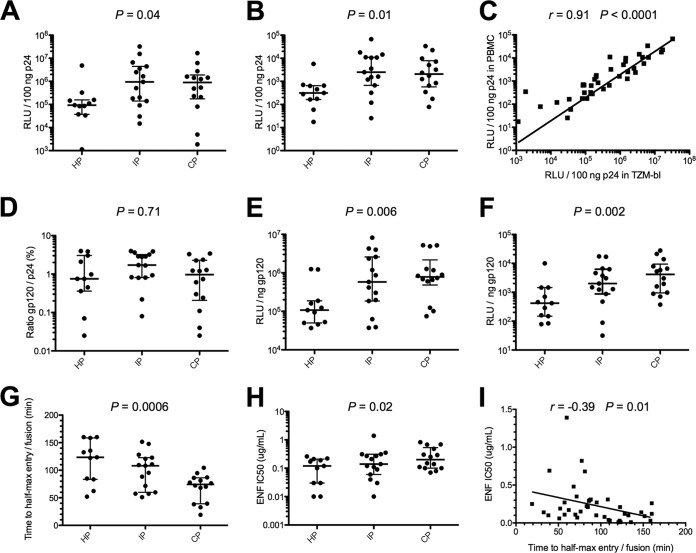
FIG 1.
Infectivity, entry kinetics, and sensitivity to enfuvirtide of Env-pseudotyped viruses. Infectivity of Env-pseudotyped viruses derived from historical patients (HP; n = 11), intermediate patients (IP; n = 15), and contemporary patients (CP; n = 14) in TZM-bl cells (A) and in CD8-depleted PBMCs (B). The infectivity of each 293T-cell-derived pseudotyped virus, with inputs normalized for amount of p24, was evaluated 48 h postinfection by assaying luciferase activity (reported as relative luminescence units [RLU]). Scatter dot plots show the distributions of infectivity values for pseudotypes of each period, expressed as RLU per 100 ng of p24. (C) Correlation between infectivity values in TZM-bl cells and CD8-depleted PBMCs. (D) Comparison of Env contents of pseudotypes derived from HP, IP, and CP. Scatter dot plots show the distributions of Env content measured as the gp120/p24 ratio. Comparison of infectivity of Env pseudotypes from HP, IP, and CP in TZM-bl cells (E) and CD8-depleted PBMCs (F) after normalization for Env content (1 ng) by dividing the infectivity RLU values (measure of infectivity) by the gp120/p24 ratio. Scatter dot plots show the distributions of infectivity values for pseudotypes of each period, expressed as RLU per 1 ng of Env. (G) Comparison of entry kinetics of Env-pseudotyped viruses from HP, IP, and CP. Env pseudotypes were added to TZM-bl cells on ice. Cells were spinoculated at 4°C to facilitate binding of viruses, and then cold medium was replaced by prewarmed medium. Saturating concentrations of ENF were then added at various times (0, 5, 10, 20, 40, 80, and 160 min), and infectivity was evaluated 72 h later by measuring luciferase activity (RLU). Scatter dot plots show the distributions of entry kinetic values for pseudotypes of each period, expressed as the time for half-max entry. (H) Comparison of ENF sensitivity of Env-pseudotyped viruses derived from HP, IP, and CP. Scatter dot plots show the distributions of IC50s of ENF for pseudotypes of each period. (I) Correlation between ENF sensitivities and entry kinetics. Differences between viruses over calendar time were evaluated using a Jonckheere-Terpstra test.

