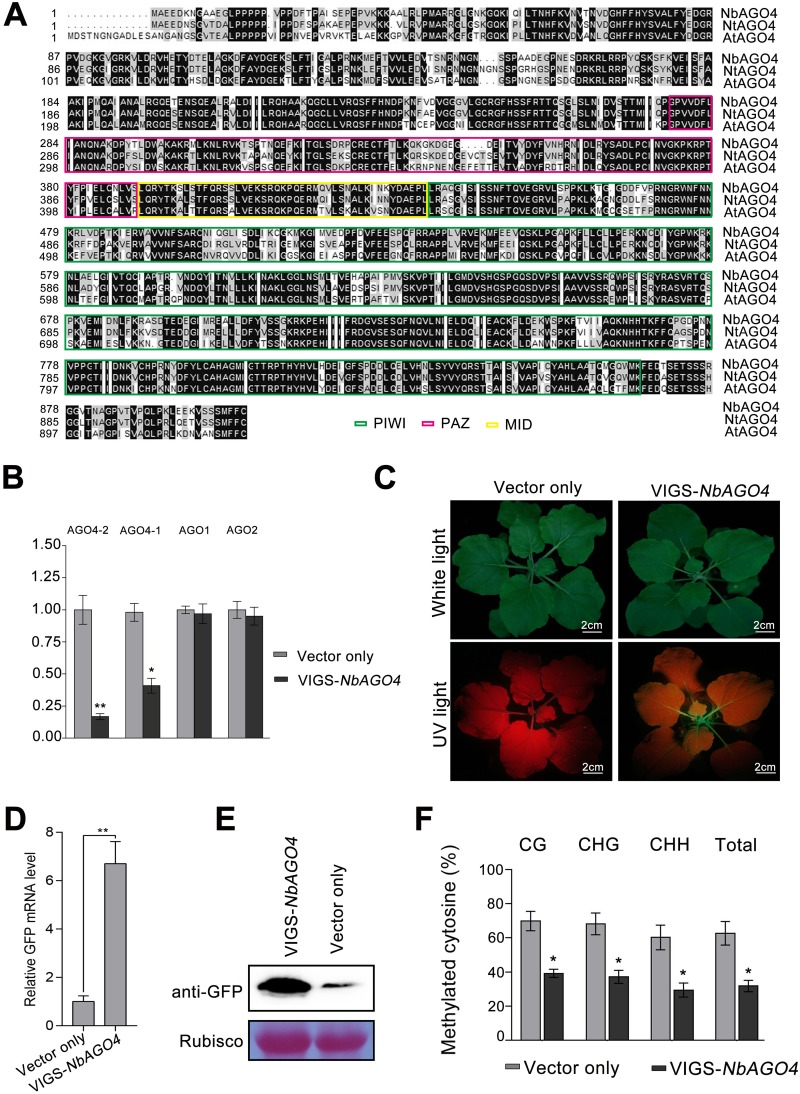
FIG 2.
Silencing of NbAGO4 reverses TGS in 16c-TGS plants. (A) Alignment of Argonaute 4 amino acid sequences from N. benthamiana, N. tabacum, and Arabidopsis thaliana. The alignment was performed with Clustal X. The black background represents 100% conserved residues across the three species. Numbers on the left indicate the positions of amino acid residues. The PIWI, PAZ, and MID domains are marked with colored rectangles. (B) RT-qPCR showing the relative mRNA levels of NbAGO4-2, NbAGO4-1, NbAGO1, and NbAGO2 in NbAGO4-silenced plants. The asterisks indicate significant differences (Student’s t test, P < 0.01). The bars represent means ± standard deviations (SD). Data were obtained from three independent experiments. (C) 16c-TGS plants were infected with TRV-NbAGO4 or TRV. Photographs were taken under white light or UV light at 14 days postinfiltration (dpi). (D) RT-qPCR showing relative GFP mRNA levels. The asterisks indicate significant differences (Student’s t test, P < 0.01). The bars represent means ± SD. Data were obtained from three independent experiments. (E) Immunoblot assay of GFP protein using anti-GFP antibody. RuBisCO was stained with Ponceau Red as a loading control. (F) Percentage of methylated cytosine in CaMV 35S promoter sites in 16c-TGS plants infected with TRV-NbAGO4 or the TRV control. The histogram represents the proportion of methylated cytosine residues in different sequence groups. The asterisks indicate significant differences (Student’s t test, P < 0.01). The bars represent means ± SD. Data were obtained from three independent experiments.

