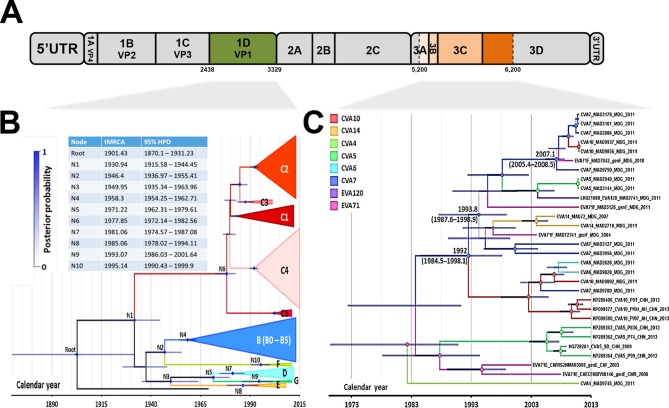
FIG 3.
Evolutionary history of EV-A71 genogroup F, as assessed by maximum clade credibility phylogenetic analysis. (A) Patterns of evolution were reconstructed for EV-A71 from the nucleotide sequences encoding the capsid protein 1DVP1 and for a segment of the P3 (nonstructural protein-encoding) region, as indicated on the schematic diagram of the EV genome. (B) Maximum clade credibility tree based on the capsid protein 1DVP1 sequence, including EV-A71 of various geographic origins from all described EV-A71 (sub)genogroups. (C) Maximum clade credibility tree based on the nonstructural P3 region specifically including EV-A71 strains within genogroup F and EV-A sequences belonging to clade I (Fig. 1D). The maximum clade credibility trees were inferred by Bayesian Markov chain Monte Carlo analysis, with a discrete model, to determine the virus corresponding to tree branches. Tips are scaled according to the date of virus sampling (timescale on the x axis). The main lineages are color coded according to EV-A71 (sub)genogroup and EV-A type. Time to the most recent common ancestor (tMRCA) and highest posterior probability density (HPD) intervals (blue lines) are indicated for the main nodes. The size of the circles at the nodes is proportional to posterior probability (PP).

