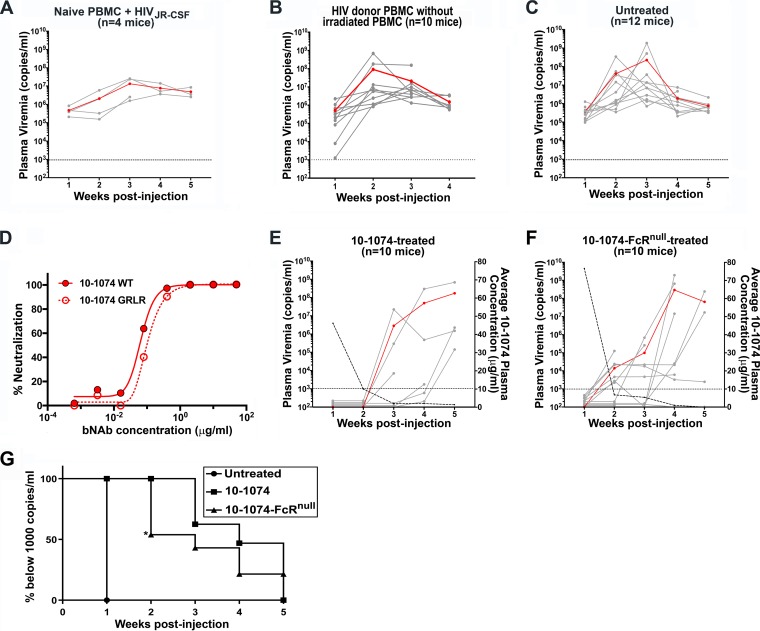
FIG 4.
Construction of SPHIR mice and treatment with 10-1074 or 10-1074-FcRnull. (A) Plasma HIV RNA levels (copies/ml) in individual NSG mice were measured at weekly intervals after intrasplenic coinjection of irradiated allogeneic PBMC (6 × 10⁶ cells) and 30 × 106 of HIV-naive PBMC and HIVJR-CSF (∼1 × 10⁶ IU/3 × 107 PBMC). (B and C) NSG mice were intrasplenically injected with OM5001 PBMC (30 × 106) with either no added irradiated allogeneic PMBCs (B) or coinjected with irradiated allogeneic PMBCs (6 × 10⁶) from three HIV-naive donors (C). HIV loads in the plasma were measured in weekly bleeds and are indicated by solid gray lines, with the geometric mean of plasma viremia indicated by a red line (scale on the left axis). The dotted line represents detection limit of 1,000 copies/ml. (D) The neutralization activity of 10-1074 and 10-1074-FcRnull was evaluated by ex vivo neutralization of infection of TZM-bl cells with a 10-1074-sensitive subtype B virus, X2278, with the indicated concentrations of 10-1074 and 10-1074-FcRnull. (E and F) Mice were intrasplenically coinjected with OM5001 PBMC (30 × 106) with irradiated allogeneic PMBC (6 × 10⁶) from three HIV-naive donors and intravenously treated with one dose (0.5 mg) of either unmodified 10-1074 (E) or 10-1074-FcRnull (F). The mice were bled weekly to measure HIV loads in the plasma and the 10-1074 or 10-1074-FcRnull plasma concentrations. The plasma viral loads of individual mice are indicated by solid gray lines, with the geometric mean of plasma viremia indicated by a red line (scale on left axis), and the dotted line represents detection limit of 1,000 copies/ml. The average plasma antibody concentration in the mice is indicated by the dashed line (scale on the right axis). (G) Kaplan-Meier plots summarizing the time-to-viremia data. The percentage of mice with undetectable viremia after intrasplenic injection with OM5001 PBMC and irradiated allogeneic PMBC with no treatment (C) or treated with 10-1074 (E) or 10-1074-FcRnull (F) is displayed on the y axis, and the time when viremia was first detected is displayed on the x axis. The indicated level of statistical significance (*) at week 2 comparing 10-1074-treated and 10-1074-FcRnull-treated mice was P = 0.0195 and was determined by a log-rank test and chi-square analysis with df = 1 for comparing the survival probability between two groups.

