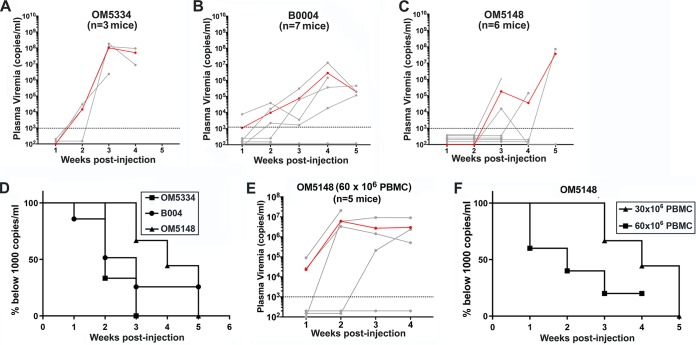
FIG 8.
In vivo reactivation of latently HIV-infected donor cells results in plasma viremia. Plasma HIV RNA levels (copies/ml) in individual NSG mice were measured at weekly intervals after intrasplenic coinjection of irradiated allogeneic PBMC (6 × 10⁶ cells) and 30 × 106 of OM5334 donor PBMC (A), B004 donor PBMC (B), or OM5148 donor PBMC (C). The geometric mean plasma viremia (red line) and the detection limit of 1,000 copies/ml (dotted line) are shown. (D) Kaplan-Meier plots summarizing the time-to-viremia data. The percentages of mice with undetectable viremia (<1,000 copies/ml) after intrasplenic injection with 30 × 106 PBMC from either donor OM5334, B004, or OM5148 shown in panels A, B, and C are displayed on the y axis, and the times when viremia was first detected are displayed on the x axis. (E) The viral loads in the plasma of NSG mice after intrasplenic coinjection of OM5148 PBMC (60 × 106 cells) and irradiated allogeneic PBMC (12 × 106 cells). The red line indicates the geometric mean of plasma viremia. The dotted line represents detection limit of 1,000 copies/ml. (F) Kaplan-Meier plots summarizing the time-to-viremia data. The percentages of mice with undetectable viremia (<1,000 copies/ml) after intrasplenic injection with OM5148 PBMC (60 × 106 cells) shown in panel E compared to OM5148 PBMC (30 × 106 cells) shown in panel C are displayed on the y axis, and the times when viremia was first detected are displayed on the x axis.

