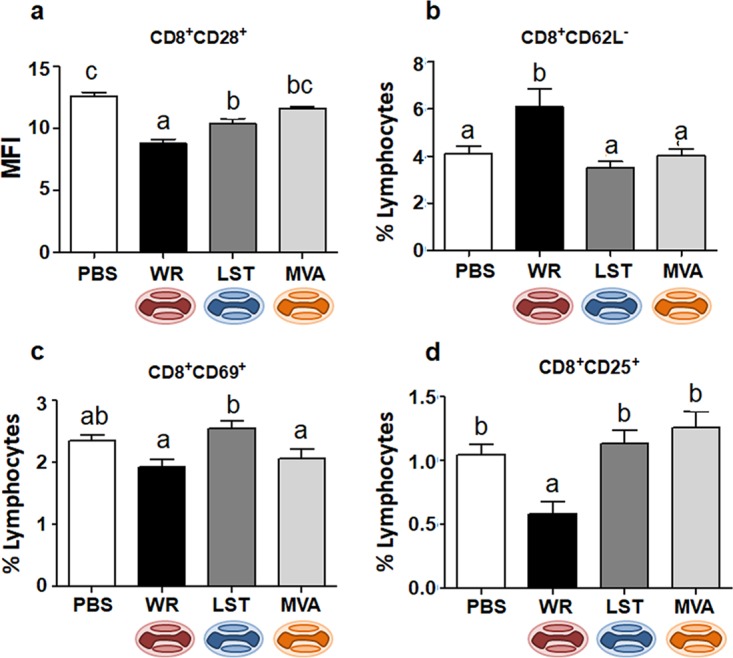
FIG 5.

Expression of activation markers in CD8+ T cells from VACV-infected or uninfected mice. Mice were infected intranasally, and splenocytes obtained at 14 days p.i. were incubated with fluorochrome-labeled antibodies to detect the expression of CD28 (a), CD62L (b), CD69 (c), and CD25 (d) in CD8+ T cells. In panel a, bars represent the means ± standard errors of the mean fluorescence intensity (MFI) values of costimulatory molecules on CD8+ lymphocytes; in panels b to d, bars represent the means ± standard errors of each cell phenotype frequency compared to the total number of lymphocytes. Different letters indicate statistical differences (P < 0.05) between groups (n = 7). For better visualization and orientation, colorful virus cartoons represent virus-infected groups in all figures (red, VACV-WR; blue, VACV-LST; orange, MVA).
