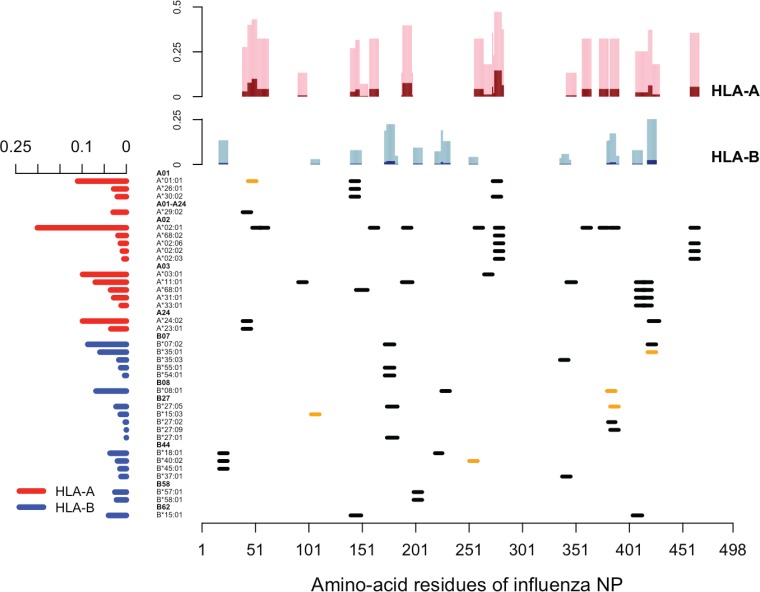
FIG 2.
Distribution of CD8 T cell epitopes derived from the nucleoprotein of human IAV. In the main panel, each segment represents one unique CD8 T cell epitope derived from nucleoprotein of human IAV, aligned with its relevant HLA allele. Epitopes that have empirically verified escape mutants reported are labeled in orange. The bar graph on the left shows the weighted average frequency of the alleles, which are grouped into 11 supertypes (highlighted in boldface). The bar graph at the top shows the fractions of the population in which the virus with a mutation in the corresponding amino acid may have a selective advantage. The fractions of homozygote are shown in dark shades (dark red for HLA-A and dark blue for HLA-B), and the fractions of heterozygote are in light shades (pink for HLA-A and light blue for HLA-B).

