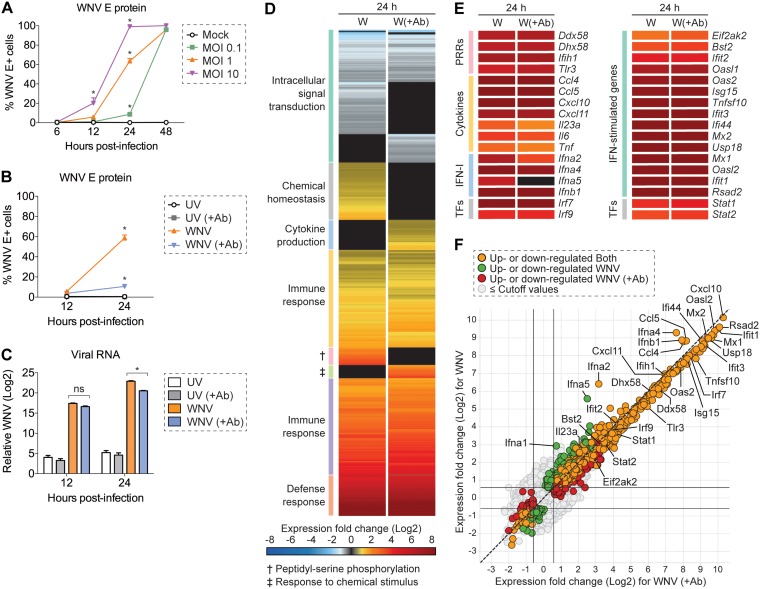
FIG 1.
Population-level analysis of WNV infection in L929 cells. (A) L929 cells were infected with WNV at an MOI of 0.1, 1, or 10 and incubated for 6, 12, 24, or 48 h (n = 3). (A and B) Intracellular viral E protein staining was performed by flow cytometry using WNV E16 antibody. (B and C) L929 cells were inoculated with UV-inactivated WNV (UV) or WNV at an MOI of 1 and incubated for 12 or 24 h in the presence (+Ab) or absence of WNV E16 neutralizing antibody (5 μg/ml) to reduce in vitro spread (n = 3). (C) Viral RNA quantification was measured by qPCR, and the CT values were normalized to the reference gene Gapdh and represented as the fold change over time-matched mock values. (A to C) Two-way ANOVA with multiple comparison correction was used to test for significance (*, P < 0.05). (D to F) Cells were infected as described for panel B and examined by bulk RNA-seq analysis at 24 h postinfection (n = 3). (D and E) Heat map showing mean gene expression values normalized and represented as the fold change over time-matched mock values. Expression fold change values correspond to the color gradient (bottom). (D) Gene cluster description can be found on the left. (E) Expression fold change displayed for a panel of select genes. (F) Scatter plot for comparison of upregulated and downregulated genes in WNV and WNV (+Ab) conditions. Cutoff values were as follows: 1.5-fold change and P < 0.01.

