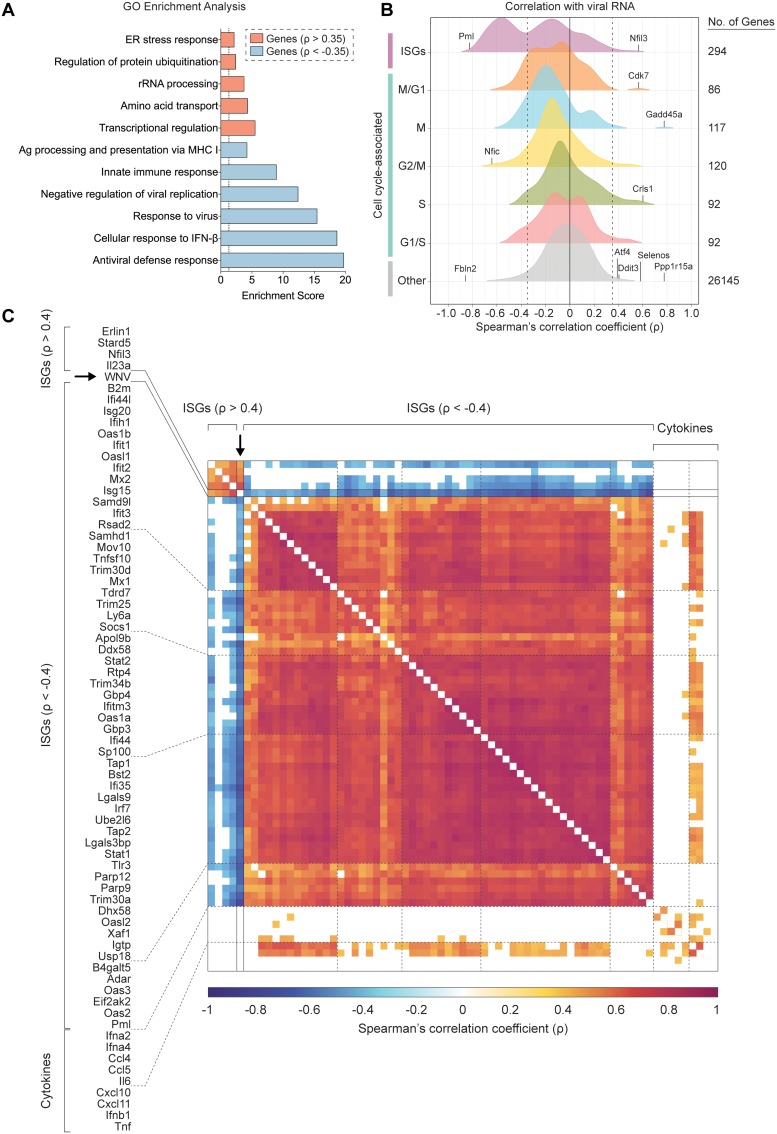
FIG 5.
ISGs negatively correlate with WNV RNA abundance. (A) Gene ontology (GO) enrichment analysis for genes significantly (P < 0.001) positively correlated (ρ > 0.35) and negatively correlated (ρ < −0.35) with viral RNA. Enrichment scores (ES) calculated for each pathway by the formula: –log10(P value). Dotted line indicates significance cutoff (P = 0.05; ES = 1.3). (B) Density plots of host gene expression correlated viral RNA across all WNV cells. Spearman’s correlation coefficients (ρ) calculated for each host gene by viral RNA. Gene set labels (left) and totals (right) are shown. Cell cycle-associated genes are additionally subdivided by phase. Select genes were marked and labeled. Dotted lines indicate correlation coefficients (ρ) equal to −0.35 and 0.35. (C) Correlation matrix for 57 of 124 negatively correlated ISGs, all positively correlated ISGs, 9 noncorrelated cytokine genes, and WNV RNA. Correlation coefficients (ρ) calculated for each gene pairing are indicated by the color gradient (bottom). White boxes represent comparisons for which the correlation did not meet the significance cutoff (P < 0.001).

