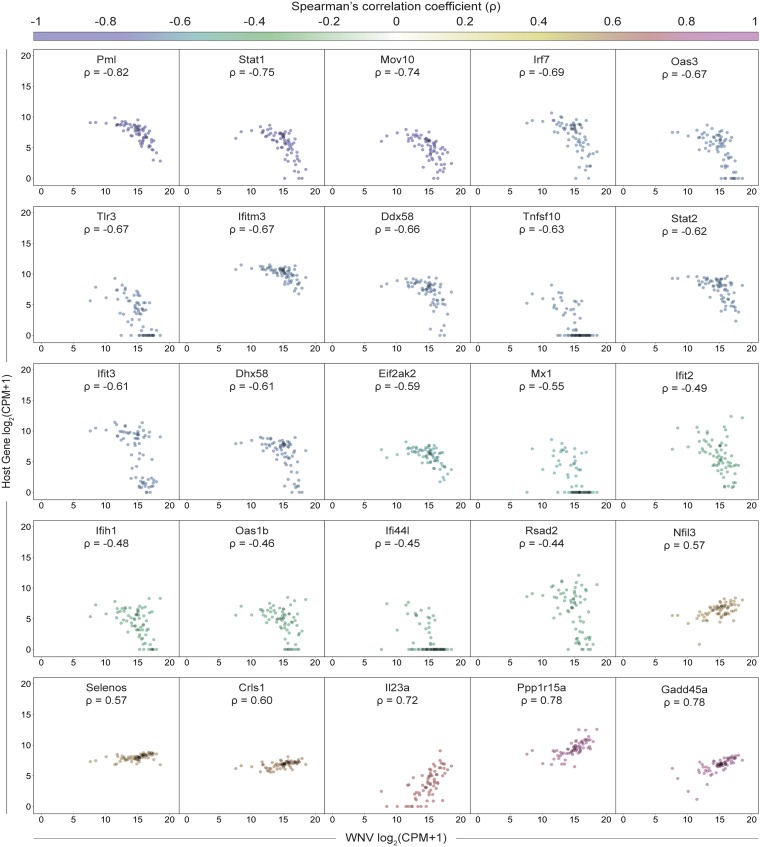
FIG 6.
Sharp downward trend for ISGs negatively correlated with viral RNA. Scatter plots showing expression as counts per million transcripts (CPM) in log2 scale of positively and negatively correlated host genes by WNV RNA. Each cell is represented by a single dot with minimal transparency so areas of high density are easily discernible. Correlation coefficients (ρ) are indicated for each gene and correspond to the color gradient (top). Scatter plots have been collated from lowest to highest correlation coefficient. All genes shown here meet the following criteria: |ρ| > 0.4 and P < 0.0005.

