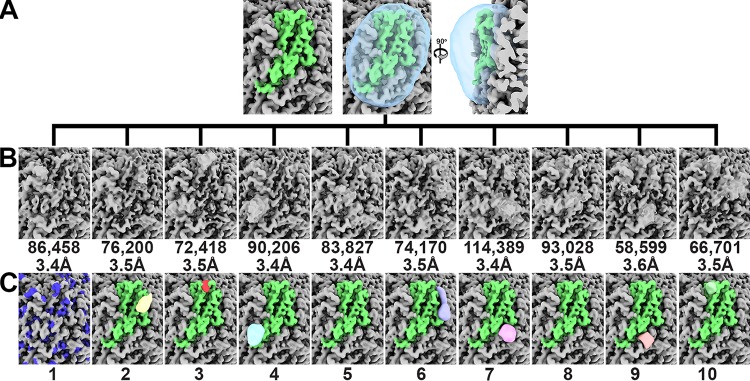
FIG 4.
Focused classification of the PCV2 VLPs liganded to heparin image reconstruction. Symmetry expansion of 13,600 particles generated 816,000 capsid subunits for analysis. The image reconstructions are shown at 2.6 sigma. (A) The molecular envelope for a subunit is shown in green. The mask used for the classification is shown as a transparent cyan blob. (B) Ten classes were requested. The number of particles and the resolution reported by the Frealign program are provided below each class. (C) Difference peaks for each class average shown in panel B. There was no difference peak for class 1. The blue patches represent the molecular envelope of the Arg/Lys side chains. The class numbers referred to in the text are presented at the bottom. Images were made with the UCSF ChimeraX program (70).

