FIG 5.
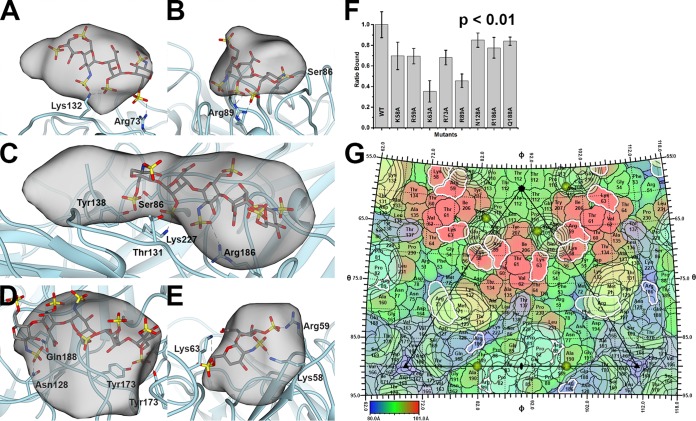
PCV2-heparin interaction. The PCV2 capsid is shown as a cyan ribbon cartoon. The difference peak (at 27 sigma) is shown as a gray transparent blob low-pass filtered to 7 Å. A modeled heparin is shown as a gray stick model. The dashed lines represent hydrogen bonds and/or salt bridges to the sulfates (red and yellow sticks) of heparin. (A) Class 2 binding site. (B) Class 4 binding site. (C) Class 6 binding site. (D) Class 7 binding site. (E) Class 10 binding site. Images were made with the UCSF Chimera program (65). (F) Bar graph representing the efficiency of 370 nM mutant PCV2 VLPs for binding to heparin, with the value for wild-type (WT) VLPs having been normalized to 1. The error bars represent the errors from five independent measurements. The image was made with the Origin 2016 program (OriginLab). The P value was calculated using the ranksum (Wilcoxon rank-sum test) routine of MATLAB 2018a (MathWorks). (G) The surface amino acids of PCV2 are plotted on a stereographic projection and colored from blue (80 Å) to red (101 Å) according to the distance from the center of the particle (see the color bar). Overlaid are contour plots at 27 sigma (black outline) for the six difference peaks. The plots are colored as described in the legend to Fig. 4. Residues with a white outline were mutated to Ala in this study, assembled into capsids, and tested for their ability to bind to heparin. Note that Lys137 and Lys227 are not colored because they did not assemble into capsids and a binding assay could not be performed. The sulfates observed in the crystal structure of PCV2 are shown as gold spheres (35). The icosahedral 5-fold, 3-fold, and 2-fold symmetry elements are depicted as a black pentagon, triangle, and ellipse, respectively. The figure was generated with the RIVEM program (50).

