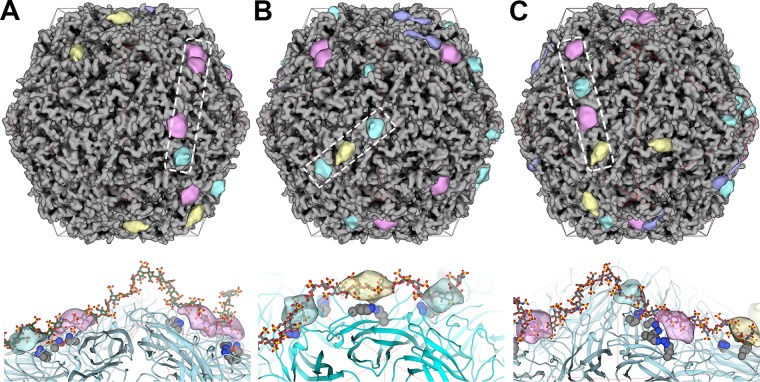
FIG 6.
Composite VLPs, where each model represents an imaged VLP-heparin complex. The coloring scheme used for the difference peaks is identical to that described in the legend to Fig. 4. (Top) The dashed box outlines the occupied binding sites that a heparin oligosaccharide is modeled into (bottom). (Bottom) A heparin oligosaccharide (gray stick model) occupying the difference peaks (transparent blobs) identified by the dashed box (top). The binding site residues are shown as gray space-filling models, and the PCV2 capsid is shown as a cyan ribbon model. A red icosahedral cage distinguishes the facets. (A) A VLP with 18 binding sites occupied by heparin. A dp36 heparin has been modeled into the outlined sites. (B) A VLP with 31 binding sites occupied by heparin. A dp24 heparin has been modeled into the outlined sites. (C) A VLP with 40 binding sites occupied by heparin. A dp36 heparin has been modeled into the outlined sites. Images were made with the UCSF Chimera program (65).

