FIG 5.
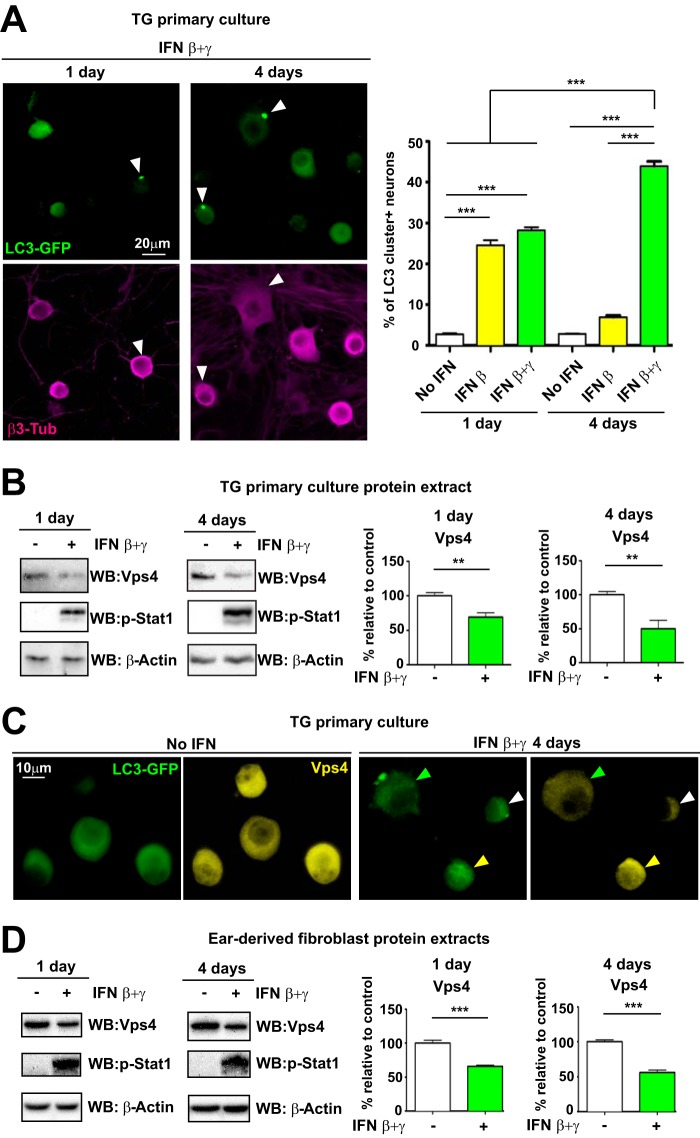
IFNs decrease Vps4 protein levels in TG mouse neurons and in other cell types. (A) (Left) Representative images from immunofluorescent microscopy of TG neurons from LC3-GFP+/− mice in cultures not treated or treated with IFN β+γ at the indicated times. LC3-GFP is shown in green, and β3-tubulin is in magenta. White arrowheads point to representative LC3 clusters. (Right) Quantification of presence of LC3-GFP clusters in cultures treated with IFN-β or IFN β+γ; n = 8 (>1,000 neurons were counted for each condition). The experiment shown is representative of two independent experiments. ***, P < 0.001. (B) (Left panels) Vps4 and p-Stat1 were analyzed by WB using TG neurons of LC3-GFP+/− mice treated with IFN β+γ at the times indicated. (Right panels) Quantification of WBs normalized to β-actin; n = 6, performed in two independent experiments. **, P < 0.01. (C) Representative images of immunofluorescent microscopy of TG LC3-GFP+/− mouse neurons. Nontreated neurons are shown in left panels. Neurons treated for 4 days with IFN β+γ are shown in right panels. Vps4 is in yellow, and LC3-GFP is shown in green. The yellow arrowhead points to an LC3 cluster-negative Vps4-strong neuron. The white arrowhead points to an LC3 cluster-negative Vps4-weak neuron. The green arrowhead points to an LC3 cluster-positive Vps4-weak neuron. (D) (Left panels) Vps4 and p-Stat1 were analyzed by WB using ear-derived fibroblasts of LC3-GFP+/− mice treated with IFN β+γ at the times indicated. (Right panels) Quantification of WBs normalized to β-actin; n = 6, performed in two independent experiments. ***, P < 0.01.

