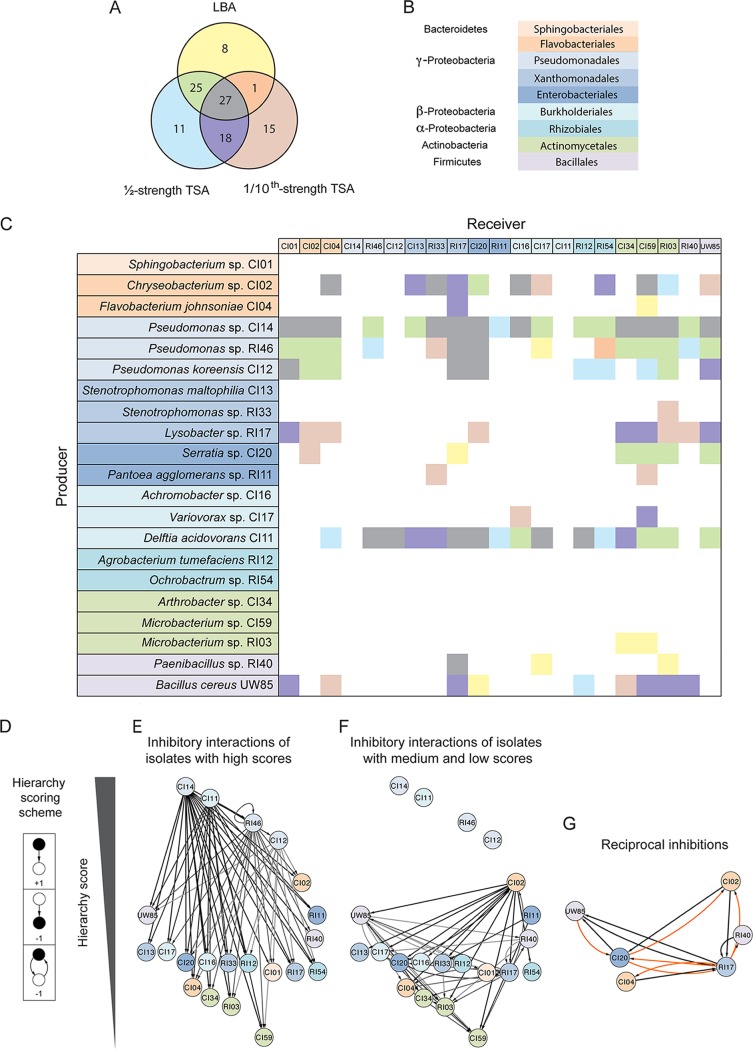
FIG 1.
Network analysis of inhibitory interactions among rhizosphere isolates. (A) Venn diagram of the inhibitory interactions identified between the isolates as determined by the presence of zones of inhibition in three media: Luria-Bertani agar (LBA), ½-strength tryptic soy agar (TSA), and 1/10-strength TSA. (B) Colors indicate phylogeny of isolates used in the inhibitory matrix and network. (C) Inhibitory interaction matrix between B. cereus UW85 and hitchhiker isolates in three media. Potential producers, which are isolates tested for the ability to inhibit others, are on the y axis, and receivers, which are isolates tested for inhibition by others, are on the x axis. There are two different color codes used in panel C. One indicates the phylogeny of isolates in the row and column title, and the second one for the matrix results using the colors scheme shown in the Venn diagram corresponding to the medium in which the interaction appears. (D) Hierarchy scoring scheme used to organize the isolates in the hierarchy interaction network, in which black is the focal point. (E and F) Inhibitory interaction network organized by hierarchy score. (E) Inhibitory interactions generated from the isolates with high hierarchy scores. (F) Inhibitory interactions generated from the isolates with medium and low hierarchy scores. (G) Reciprocal inhibitory interactions observed in the inhibitory network. Orange indicates interactions observed in only 1 medium, and black indicates interactions observed in 2 or 3 media.

