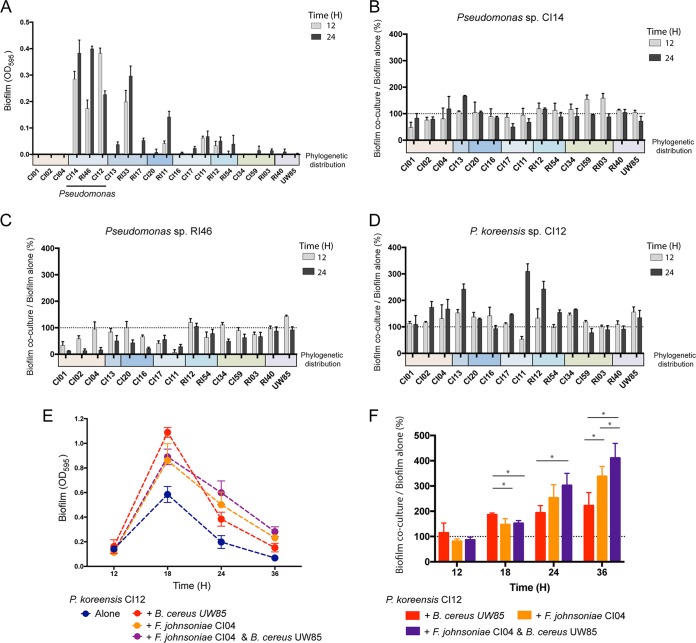
FIG 6.
Biofilm formation by rhizosphere isolates. Biofilm was quantified by measuring the optical density at 595 nm (OD595) after staining with crystal violet. (A) Crystal violet quantification of biofilm formation for each of the 21 isolates at 12 and 24 h after inoculation. (B to D) Pseudomonas biofilm production when grown with a poor biofilm producer normalized against Pseudomonas biofilm in pure culture at 12 and 24 h, either Pseudomonas sp. RI46 (B), Pseudomonas sp. CI14 (C), or P. koreensis CI12 (D). (E) Biofilm formation by P. koreensis CI12 growing alone, in coculture with either F. johnsoniae CI04 or B. cereus UW85, and in triple culture at 12, 18, 24, and 36 h. (F) P. koreensis CI12 biofilm production when grown with two other isolates normalized against P. koreensis growth in pure culture. *, P < 0.01. Colored bars under the x axis indicate phylogenetic groups as in Fig. 1. Gray dotted line, limit of detection.

