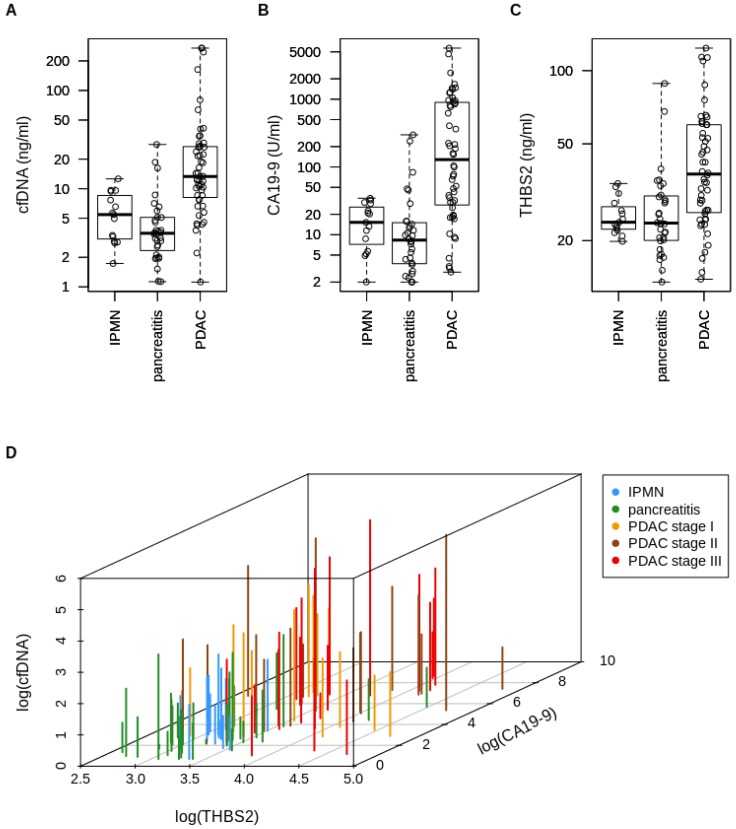
Figure 1.
Scatter plot of (A) cfDNA concentrations (IPMN vs. PDAC: p<0.0001; pancreatitis vs. PDAC: p<0.0001), (B) CA19-9 concentrations (IPMN vs. PDAC: p<0.0001; pancreatitis vs. PDAC: p<0.0001), (C) THBS2 concentrations (IPMN vs. PDAC: p=0.0007; pancreatitis vs. PDAC: p=0.0001), and (D) three-dimensional plot of log-transformed cfDNA, THBS2 and CA19-9 concentrations of patients with PDAC (n=52), IPMN (n=15) and chronic pancreatitis (n=32). cfDNA=Circulating cell-free DNA, IPMN=Intraductal papillary mucinous neoplasia, PDAC=Pancreatic ductal adenocarcinoma, CA19-9=Carbohydrate antigen 19-9, THBS2=Thrombospondin-2.

