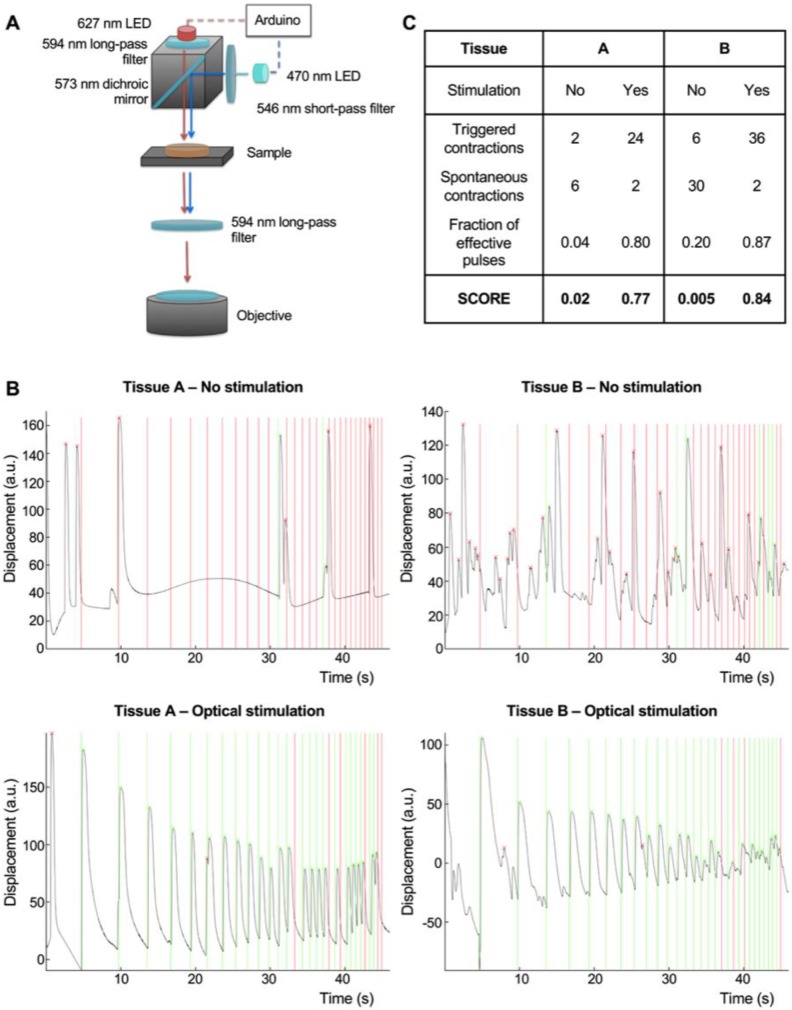
Figure 3.
Integration of an optical stimulation platform and custom video processing software for the evaluation of NMJ function. (A) Design of the optical stimulation platform. (B) Correlation between muscle contraction (black trace) and light pulses (vertical lines) for two different tissues, with and without optical stimulation. Light pulses that are followed by a contraction in the following 100 ms interval are marked as effective (green). Light pulses not followed by a contraction are marked as ineffective (red). (C) Table showing the scoring of the stimulated and non-stimulated tissues with and without correction.

