Figure 6.
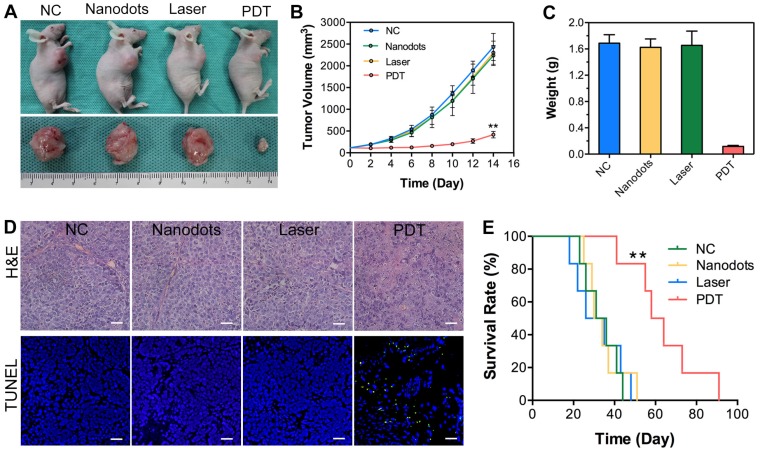
Antitumor efficacy of T-TPETS nanodots in vivo. (A) Representative photographs of xenografted and dissected tumors after different treatments. (B) Tumor volume at different time points post-treatment in 4 groups (n = 3 per group). Data represent mean ± SD. (C) Average tumor weight after 14 days of treatment. Data represent mean ± SD. (D) H&E staining for pathological changes in tumor sections (upper row). TUNEL staining (green) for apoptotic level in tumor sections (lower row). Scale bar: 50 μm. (E) Survival curves of tumor-bearing mice in 4 groups with different treatments (n = 6 per group). **P < 0.01.

