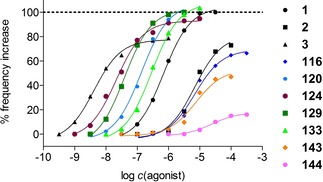
Figure 4.

Concentration‐response curves of 1, 2 and 3 (black), as well as 116, 120, 124, 129, 133, 143 and 144 (colored) at the gpH2R (atrium). Histamine (1) was used as a reference (pEC50=6.16, Emax=1.00). Displayed curves are calculated by endpoint determination (N=1).
