
Figure 5.
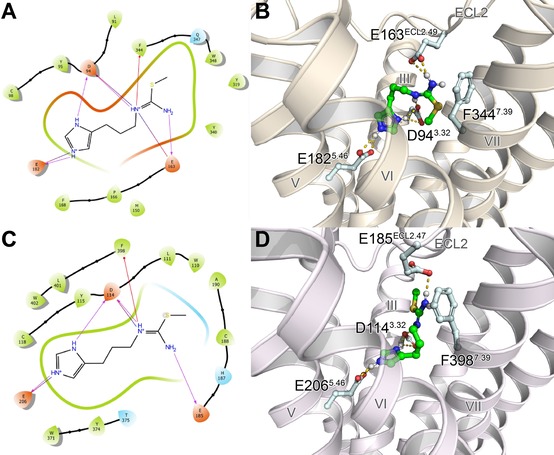
Lowest free energy (MM‐GBSA) docking poses of 143 at both the hH4R (A, B) and hH3R (C, D) showing key ligand‐receptor interactions in the form of ligand interaction diagrams (A, C) or three‐dimensional illustrations (B, D). Hydrogen bonds and salt bridges are colored in magenta (A, C) or yellow (B, D), and cation‐π interactions in red (A, C).