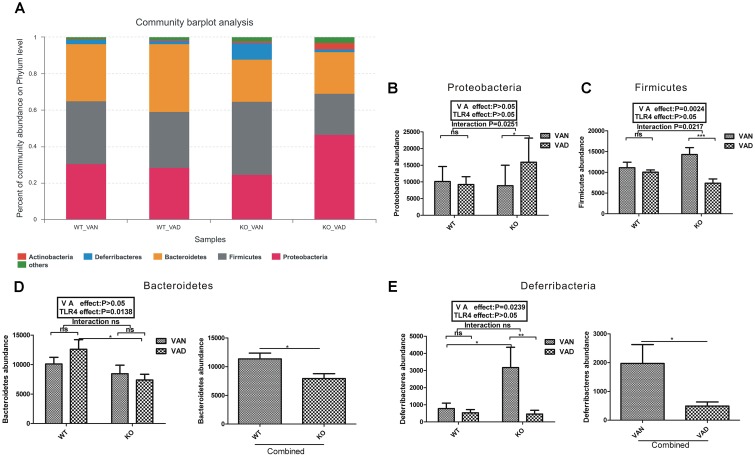
FIGURE 4.
The relative abundances of bacterial phyla in the colonic mucosa of the TLR4-/- and WT mice fed the VAN or VAD diet. (A) The dominant bacterial phyla with relative abundances greater than 1% in the four groups (n = 10). The combined effects of the different VA nutritional levels and the TLR4 deletion on the relative abundance of (B) Proteobacteria and (C) Firmicutes determined by two-way analysis of variance with a Bonferroni post hoc test (n = 10). (D) The main effect of TLR4, independent of VA nutritional level, on the relative abundance of Bacteroidetes in the four groups (n = 10). (E) The main effect of VA, independent of TLR4 deletion, on the relative abundance of Deferribacteres in the four groups (n = 10). Mean ± SEM; ns. = not significant. “Interaction” indicates an effect of the different VA nutritional levels in the TLR4 knockout vs. WT mice; ∗P < 0.05, ∗∗P < 0.01, and ∗∗∗P < 0.001. VAN, vitamin A normal; VAD, vitamin A deficiency. WT VAN refers to WT mice fed a VAN diet; WT VAD refers to WT mice fed a VAD diet; KO VAN refers to TLR4-/- mice fed a VAN diet; KO VAD refers to TLR4-/- mice fed a VAD diet.

