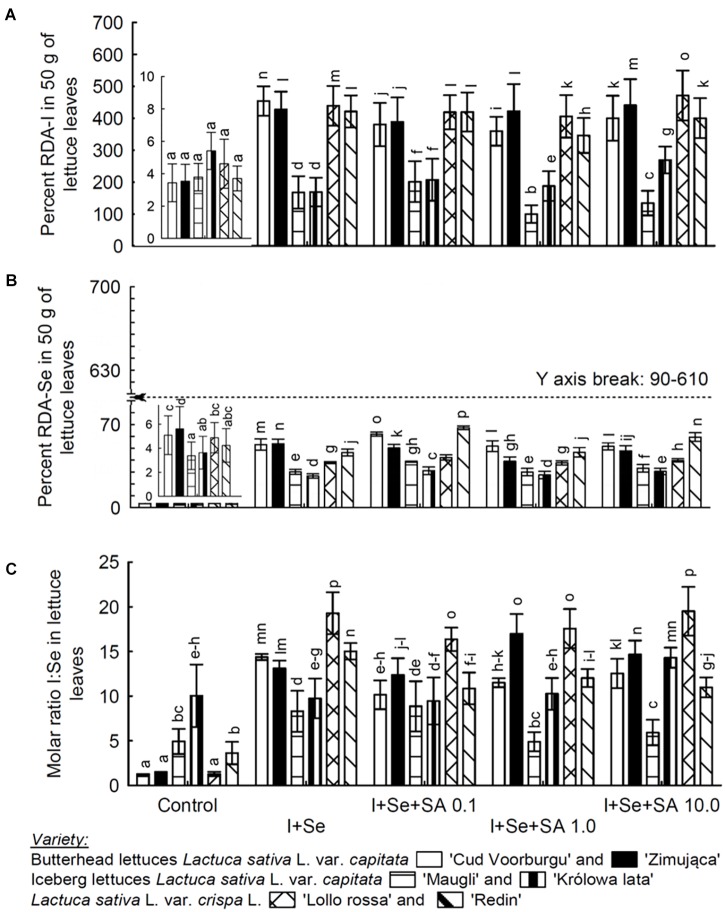
FIGURE 2.
Value percentage of recommended daily allowance (RDA) for I (A) and Se (B) in a 50-g portion of fresh lettuce and the I:Se molar mass ratio in lettuce leaves (C). (A,B) Also shows the enlargement of the bars in the graph for control plants. Means followed by different letters for “Treatments × Variety” differ significantly at P < 0.05. Bars indicate standard error (n = 8).

