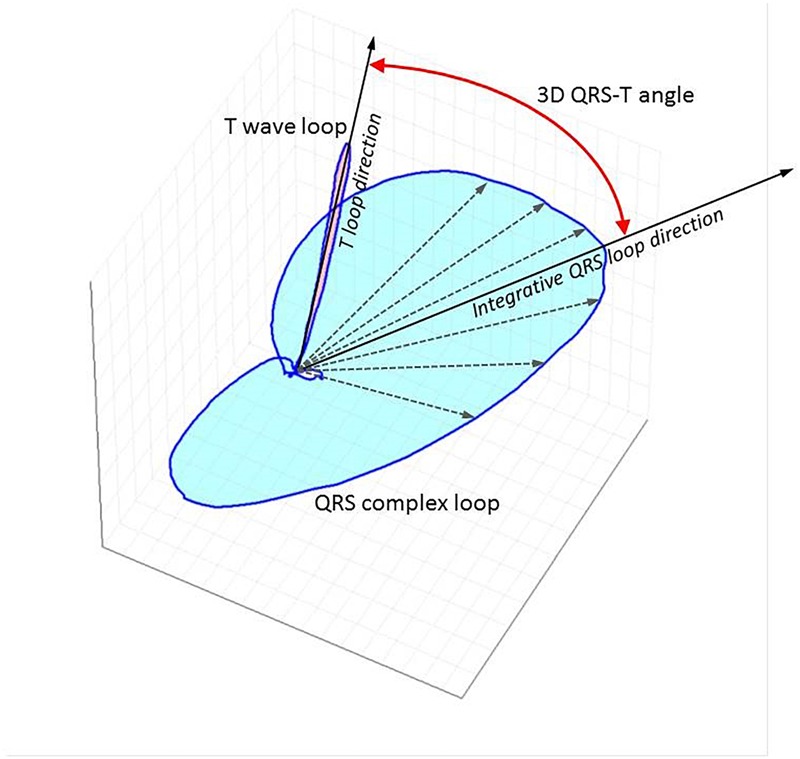
FIGURE 1.

Three-dimensional representation of QRS and T vector loops following computerized analysis of standard 12 lead ECG using singular value decomposition to yield an orthogonal lead system (TCRT method). The little white circle in the middle depicts the loop of the p wave. The curved red line with arrow at both ends depicts the spatial QRS-T angle. The maximal T wave vector magnitude is used for the calculations with this method. TCRT is the averaged cosine of the angles between the T wave vector and all vectors within the QRS complex exceeding a pre-defined level. A different method of QRS-T angle measurement from standard 12 lead digital snapshot ECG uses inverse Dower matrix for vectrographic transformation and calculates the angle between the mean vectors of the QRS and T wave. QRS-T angle has also been calculated from continuous signal averaged ECGs as the angle between the peak QRS vector and the peak T vector.
