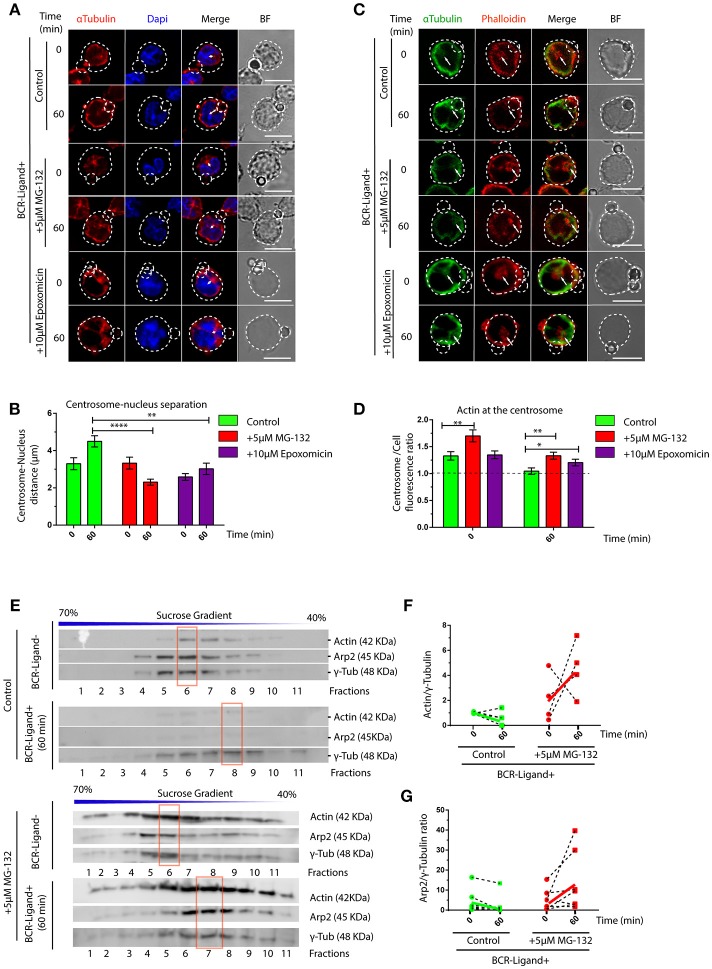
Figure 2.
Proteasome activity controls centrosome detachment from nucleus by actin clearance. (A) Representative images of control, MG-132 and Epoxomicin pre-treated B cells incubated with BCR-Ligand+ coated beads at 0 and 60 min. Cells were stained for α-Tubulin (red), and DAPI (blue). Distance between the centrosome and nucleus mass center is illustrated (white double-arrow). Scale bar = 10 μm. (B) Centrosome-Nucleus distance measurements for images in A. ****p < 0.001, *p < 0.05. N = 4 (>40 cells). (C) Representative images of control, MG-132 and Epoxomicin pre-treated B cell during activation. α-Tubulin (green) and Phalloidin (red). White arrows indicate centrosome localization. Scale bar = 10 μm. (D) Actin mass at the centrosome quantified by immunofluorescence (see Materials and Methods). **0.001 < p < 0.01. N > 5 (>100 cells). (E) Immunoblot of centrosome fractions obtained from control and MG-132 pre-treated B cells at 0 and 60 min post activation. Actin, Arp2, and γ-tubulin were detected in each fraction. Red rectangles indicate the fraction with highest γ-tubulin levels. (F,G) Rate of Actin and Arp2 change at the centrosome fraction after 60 min of activation. (N = 5), respectively. 2-way ANOVA with Sidak's post-test was performed for all statistical analysis. Mean with SEM bars are shown.

