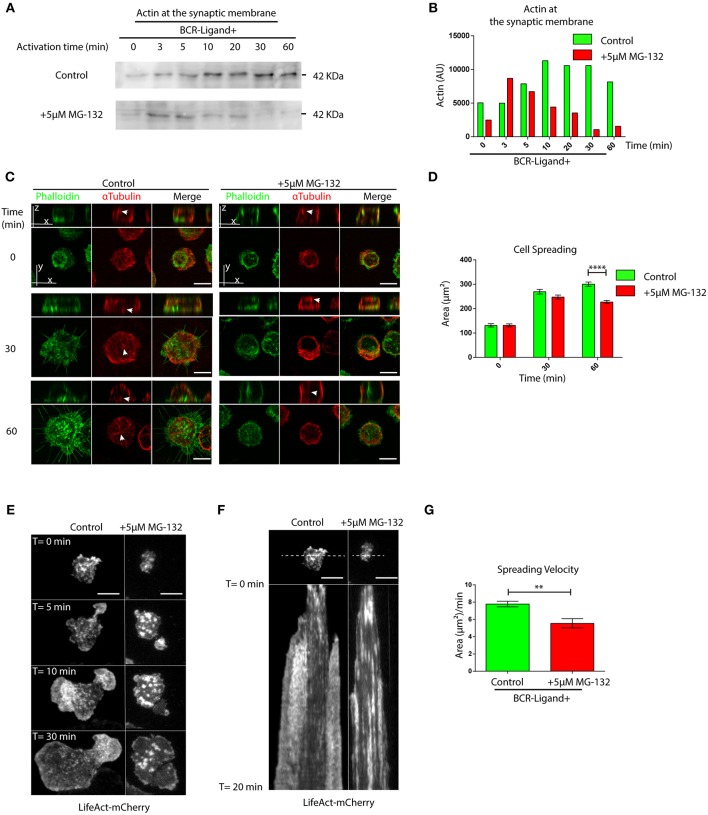
Figure 3.
Proteasome activity controls actin remodeling at the immune synapse. (A) Immunoblot showing actin levels in synaptic membranes obtained from control and MG-132 treated B cells after different time points of activation. (B) Quantification of actin at the synaptic membrane. (C) Representative images of control and MG-132 treated B cells activated on antigen-coated cover-slides for different time points. F-actin (green) and α-Tubulin (red). White arrows indicate centrosome localization. Scale bar = 10 μm. (D) Quantification of the spreading area of B cells pre-treated or not with MG-132 and activated for different time points ****p < 0.001. N = 5 (>200 cells). 2-way ANOVA with Sidak's post-test was performed. (E) Time-lapse images of Lifeact-mCherry expressing B cells pretreated or not (control) with MG-132 activated on antigen-coated coverslides. Scale bar = 10 μm. (F) Kymograph of time vs. distance obtained from a 20-min movie generated at 1 frame per 10 s showing the first 20 min of actin distribution (white) tracked by LifeAct-mCherry. Scale bar = 10 μm. (G) Velocity of spreading in control and MG-132 treated B cells expressing LifeAct-mCherry (μm2/min). **0.001 < p < 0.01. Student's t-test. N = 6. Mean with SEM bars are shown.

