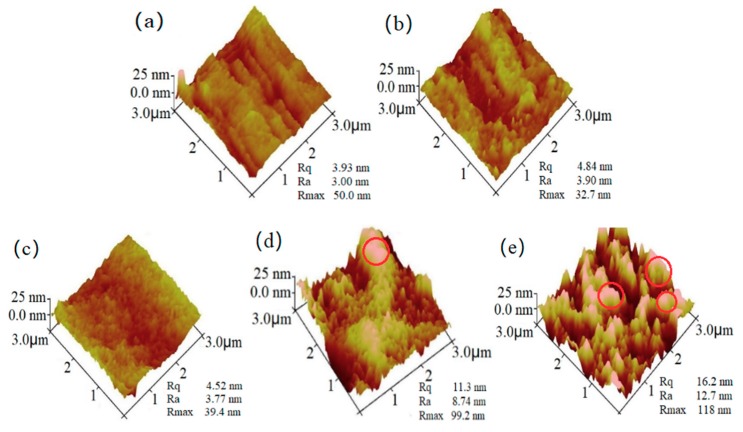
Figure 7.
AFM micrographs of the composite films with various dosages of ZnO NPs: (a) 1%, (b) 3%, (c) 5%, (d) 7% and (e) 9% with 2 wt % CMC on a dry starch basis. The area of AFM images is 3 μm × 3 μm. Rmax refers to the difference in height between the highest and lowest points on the surface relative to the mean plane; Ra, the arithmetic average roughness of the deviations from the center plane; Rq, the standard deviation of the Z values within the box cursor.

