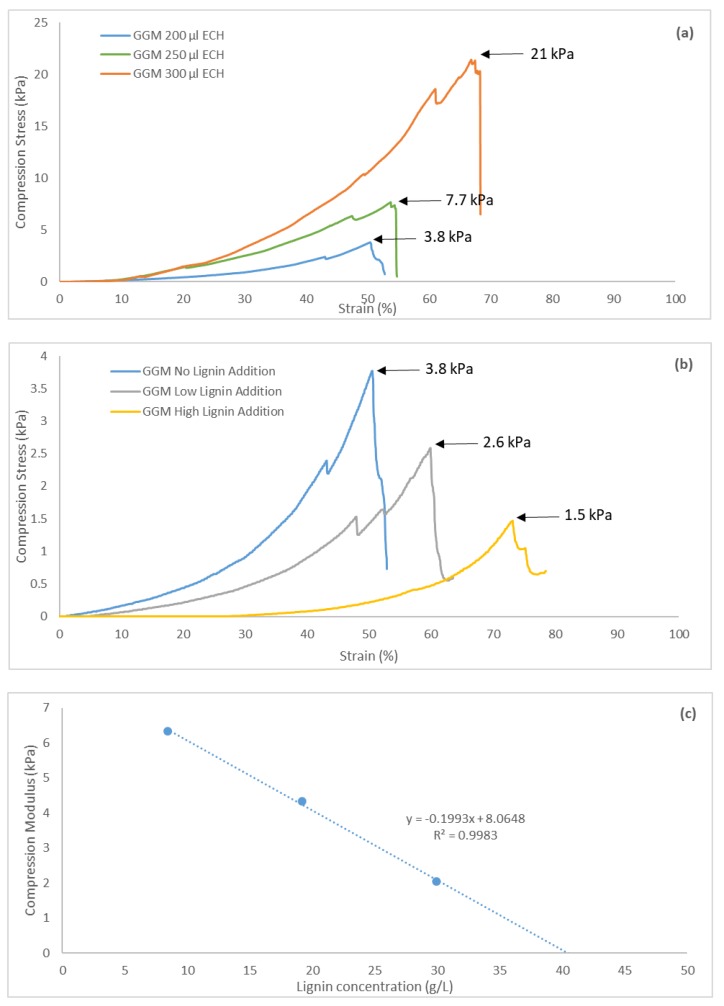
Figure 10.
Compression stress and strain for (a) three hydrogels at different ECH additions and (b) three hydrogels with different lignin additions and a constant (200 µL) ECH addition. Low lignin addition represented the 87.5/12.5 mL polysaccharide solution/mL lignin solution and the high lignin addition 75.0/25.0 mL polysaccharide solution/mL lignin solution. (c) A curve of the compression modulus as a function of lignin concentration in the base reaction mixture. The compression modulus was determined at the point of maximum UTS.

