
FIGURE 3.
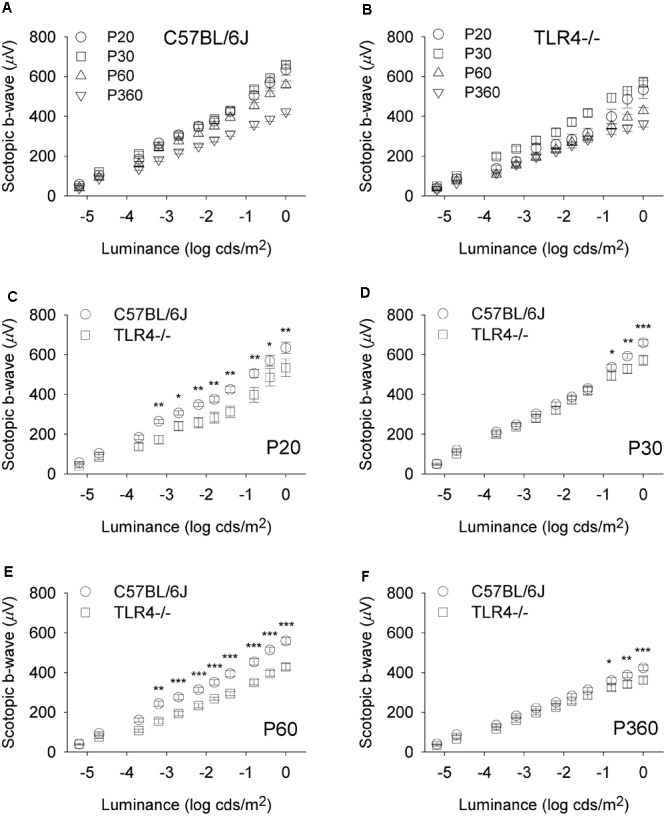
Scotopic b-wave luminance-response curves in control and TLR4-deficient mice. (A,B) Response curves for mixed scotopic b-waves obtained from control (A, C57BL/6J) and TLR4 KO (B, TLR4–/–) mice at different ages, as indicated. (C–F) Paired comparisons between C57BL/6J and TLR4–/– mice responses for each light stimulus at P20 (C), P30 (D), P60 (E), and P360 (F). Significant differences are evident between the two groups tested at all conditions (ANOVA, Bonferroni’s test; n = 6 to n = 21 in each group). ∗P < 0.05, ∗∗P < 0.01, ∗∗∗P < 0.001. Error bars represent the SEM.