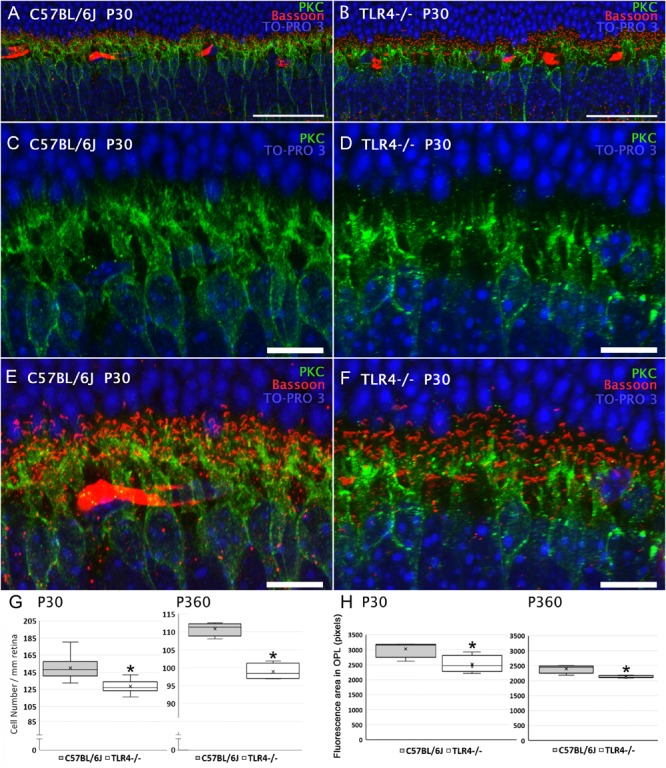
FIGURE 7.

Bipolar cells morphology and quantitation in control and TLR4-deficient mice. (A,B) Vertical sections from P30 control (A; C57BL/6J) and TLR4-deficient (B; TLR4–/–) mice retinas labeled with antibodies against PKC (rod bipolar cells, green) and Bassoon (synaptic ribbons, red). The nuclear marker TO-PRO 3 (blue) was employed to visualize all cell nuclei. (C–F) Magnification of (A,B) showing the labeling of rod bipolar cells (C,D) or the double labeling of rod bipolar cells and synaptic ribbons (E,F). Note that both positive cell bodies and dendrites were more numerous in control animals than in TLR4-deficient mice. (G) Quantitation of bipolar cells per mm of retinal section in control (gray) and TLR4 KO (white) retinas at 1 (P30) and 12 months (P360) of age. (H) Quantitation of bipolar cell dendrites in the OPL in control (gray) and TLR4 KO (white) retinas. Data are represented as mean values of fluorescence. ∗P < 0.05; ANOVA, Bonferroni’s test, n = 4 to n = 12 in each group. Error bars represent the SEM. Scale bar: 40 μm (A,B), 10 μm (C–F).
