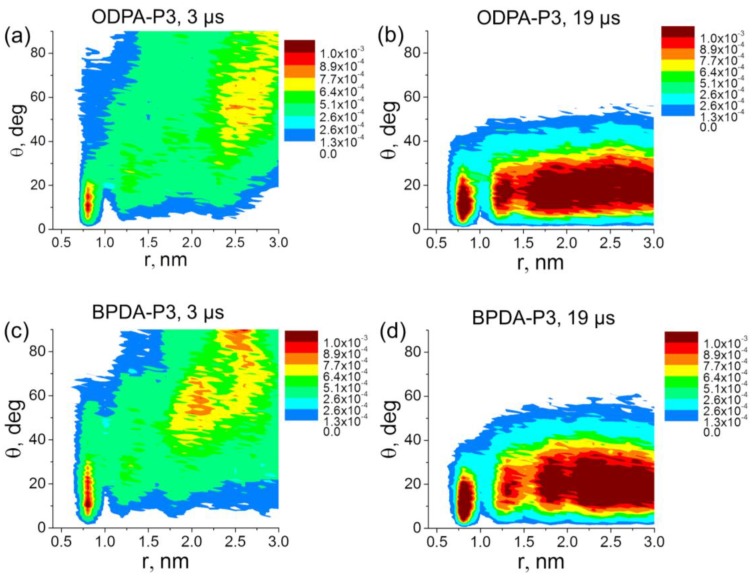
Figure 3.
The distribution of the orientation angles θ for the vector P relative to the SWCNT axis in nanocomposites based on ODPA-P3 (a,b) and BPDA-P3 (c,d) after 3 μs (a,c) and 19 μs (b,d) of simulation. The results for ODPA-P3 have been calculated after 3 μs of simulation and are taken for comparison from our previous study [30].

