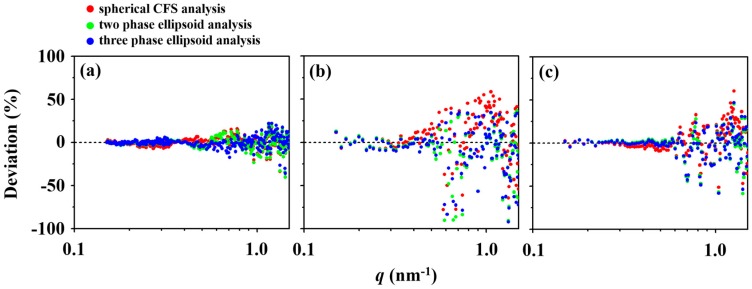
Figure 3.
Deviation between the measured scattering data and the data analysis results obtained by various analysis schemes over the q-range of 0.15 to 1.5 nm−1: (a) l-PBA-b-PEO micelle; (b) l-PBA-b-PEO-b- PBA micelle; (c) c-PBA-b-PEO micelle. Each value of deviation was calculated by the following formula [(Iobs − Icalc)/Iobs] × 100% where Iobs is the measured scattering intensity and Icalc is calculated scattering intensity from data analysis. The colored circles represent the deviations from results of spherical CFS (red circles), two-phase ellipsoid (green circles), and three-phase ellipsoid (blue circles) models. The deviations in q-range of 1.5 to 3.5 nm−1 are not shown due to the insignificantly large deviations arising from the high levels of noise in the raw scattering data in high-q regions.

