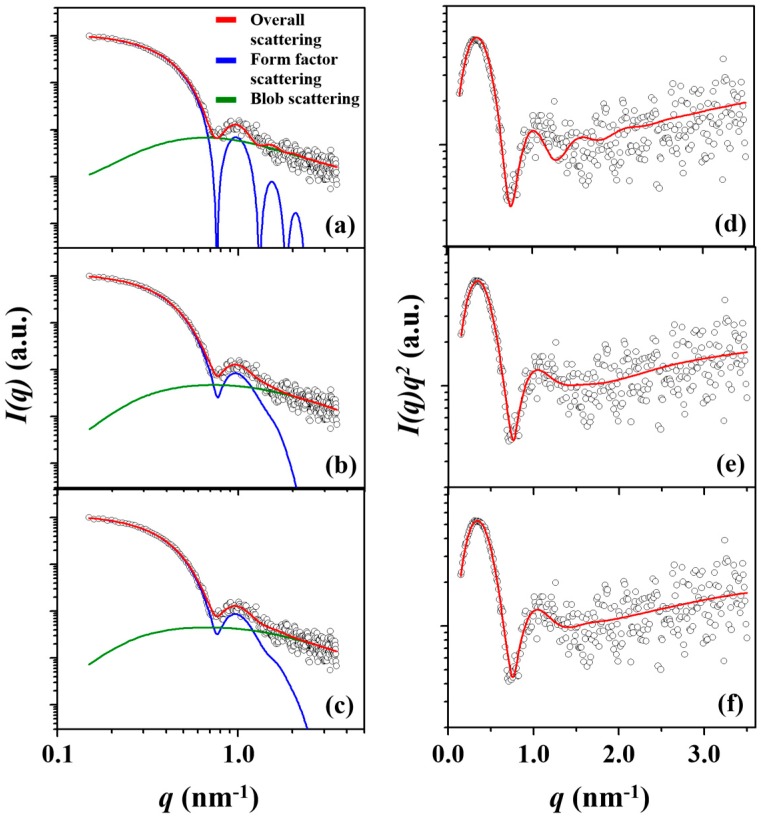
Figure 5.
A representative X-ray scattering intensity I(q) profile and data analysis results of the c-PBA-b-PEO micelle formed in deionized water with a concentration of 0.5 wt % at 25 °C, which were performed using (a) spherical CFS model, (b) two phase ellipsoid model, and (c) three phase ellipsoid model. (d–f) Kratky representations of the scattering data of the l-PBA-b-PEO micelle fitted by spherical CFS, two phase ellipsoid, and three phase ellipsoid models, respectively. In each figure, the open dot symbols are the measured data and the red solid line represents the sum of the corresponding analysis profile (blue line) and blob contribution (green line). q = (4π/λ)sinθ in which 2θ is the scattering angle and λ is the wavelength of the X-ray beam used.

