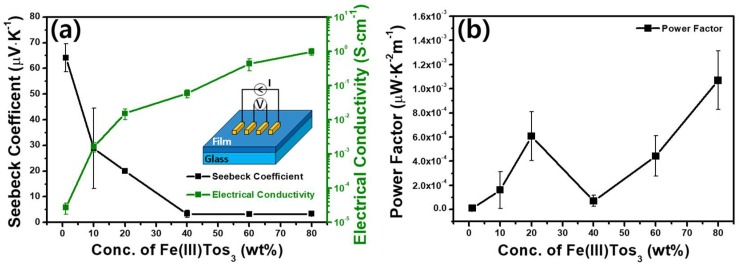
Figure 7.
(a) The electrical conductivities and the Seebeck coefficients of PEDOT-Tos with different catalyst concentrations (the error bars are based on the standard deviations of the measured data) are plotted (the error bars are based on the standard deviations of the measured data). (b) Power factor (S2·σ) based on the measured data is also calculated with µW·K-2m-1 unit and plotted.

