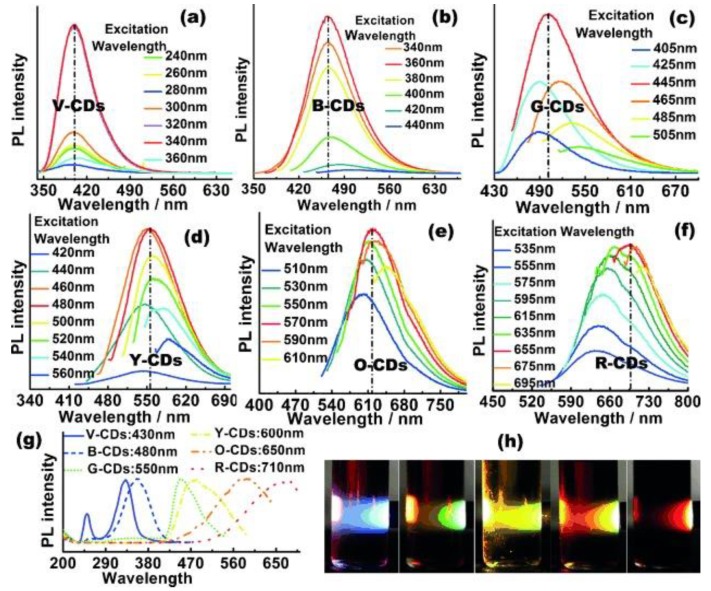
Figure 3.
Tuning carbon dots’ emission to violet, blue, green, yellow, orange, and red: (a–f) PL spectra of V-, B-, G-, Y-, O-, and R-CDs, showing different strongest emission peaks; (g) PLE spectra of the six samples; (h) emission photos of different carbon dots excited by white light. (Reproduced with permission from ref. [31]. Copyright 2015 John Wiley & Sons, Hoboken, NJ, USA).

