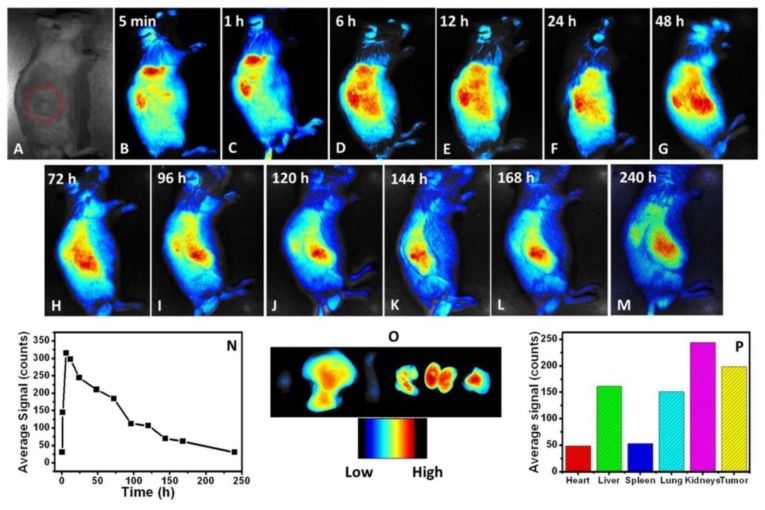
Figure 7.
PEGylated carbon dots for NIR bioimaging: Time based in vivo red fluorescence images of BALB/c mouse bearing CT26 tumours after the intravenous (i.v.) injection of CyCD (the tumour is circled with a red dotted line). (A) 0 min (taken under natural light; the red circle marks the position of tumour); (B) 5 min; (C) 1 h; (D) 6 h; (E) 12 h; (F) 24 h; (G) 48 h; (H) 72 h; (I) 96 h; (J) 120 h; (K) 144 h; (L) 168 h; and (M) 240 h; (N) Average fluorescence intensity of the tumour area as a function of time; (O) Ex vivo imaging of the tissues 48 h post-injection (from left to right: heart, liver, spleen, lung, kidneys, and tumour); (P) Average fluorescent intensity of heart, liver, spleen, lung, kidneys, and tumour. (Reproduced with permission from Reference [25]. Copyright 2016 American Chemical Society).

