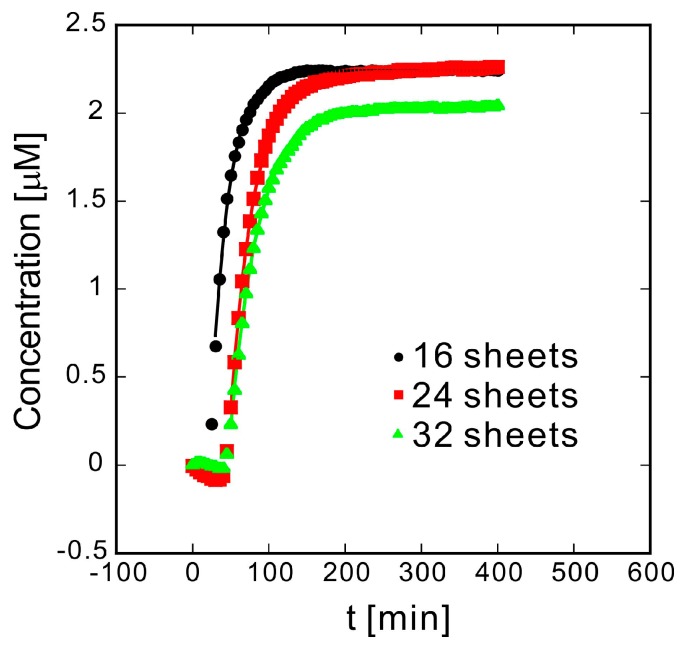
Figure 4.
Time dependence of methylene blue absorbance at 664 nm for different quantities of laminated sheets. The markers indicate experimental results, and the solid line is the result of fitting the experimental data to the exponential function (m1 × (1 − e(−m2 × (t−m3))) using the least squares method.

