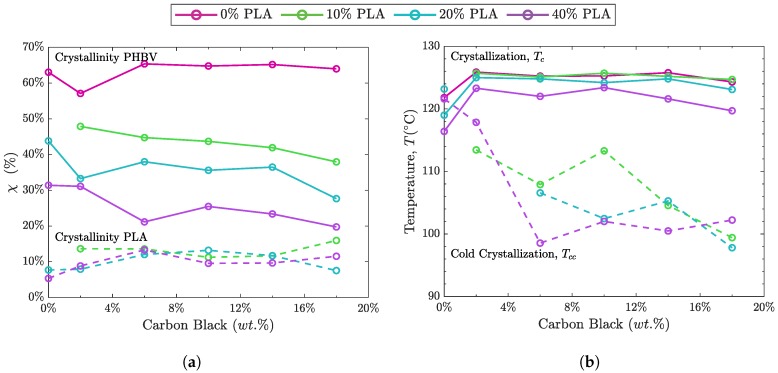
Figure 7.
DSC results summarizing: (a) The percent crystallinity () as determined through DSC for (solid lines) the PHBV phase of the blend and (dashed lines) the PLA phase of the blend. The impact of the vol.% of the polymer within the blend is more significant in determining crystallinity than the wt.% of CB; (b) the shift in crystallization temperature, , with increasing CB for the PHBV phase of the blend (solid lines) and the shift in cold crystallization temperature, , for the PLA phase of the blend (dashed lines). For the PLA phase, decreases with increasing wt.% of CB.

