
Fig. 3. Phylogenetic relationships among baboon species.
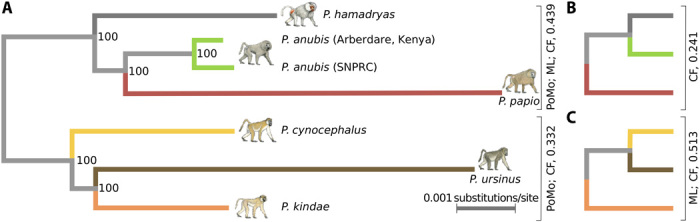
(A) Phylogeny generated using the polymorphism-aware phylogenetic method (PoMo) (23, 24). This topology for the three northern species is also supported by ML analysis of concatenated SNVs and by 43.9% of informative gene trees filtered to exclude any coding sequence genes [scaled concordance factor (CF) of 0.439, greater than the other two alternatives]. The topology shown for the three southern clade species is supported by the PoMo analysis and has a scaled CF score of 0.332. (B) One alternative topology for the northern species, supported by a scaled CF of 0.241. (C) One alternative topology for the southern species, supported by ML analysis of concatenated SNVs and a scaled CF score of 0.513, i.e., a larger proportion of gene trees that are devoid of coding genes than the other two alternative trees.