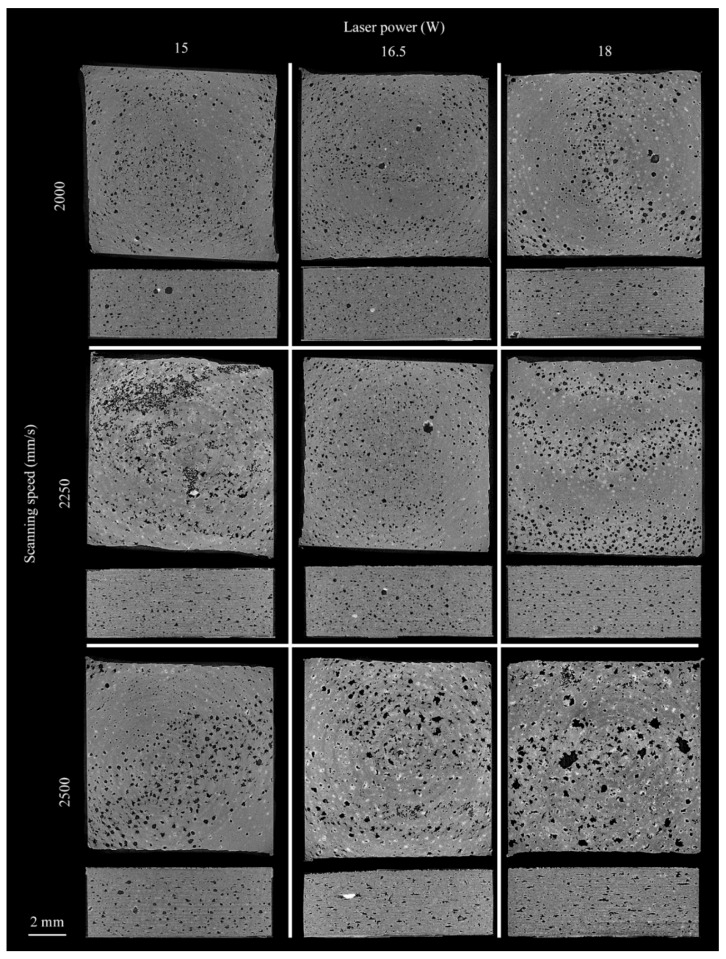
Figure 8.
Representative slices from each of the sample batches. The slices display the interlayer connection and the side view of the samples. The sample slices are organized as: top row: 2000 mm/s scanning speed; middle row: 2250 mm/s scanning speed; bottom row: 2500 mm/s scanning speed; left column: 15 W laser power; middle column: 16.5 W laser power; right column: 18 W laser power.

