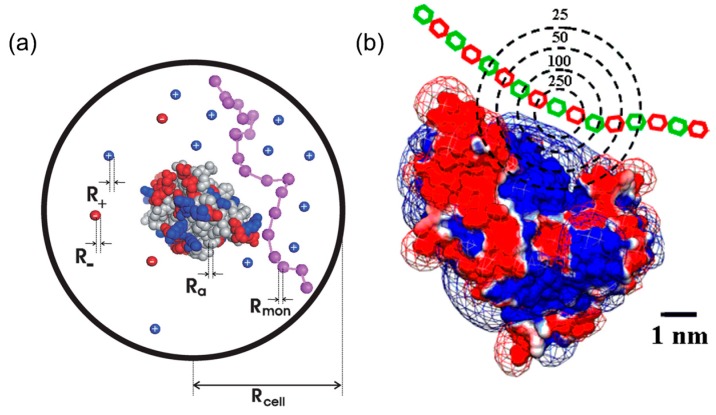
Figure 1.
Schematic representation of different protein–PE binding mechanisms. For charge regulation theory (a), polyeletrolytes, represented by purple chain, and proteins with positive (blue) and negative (red) residues are surrounded by counter ions within a spherical space denoted as a cell. For charge anisotrpy theory (b), proteins with positive (blue) and negative (red) patches as visualized by Delphi interacts with polyelectrolytes with different charged units (red and green). Figure 1 was taken from the works of [21,30].

