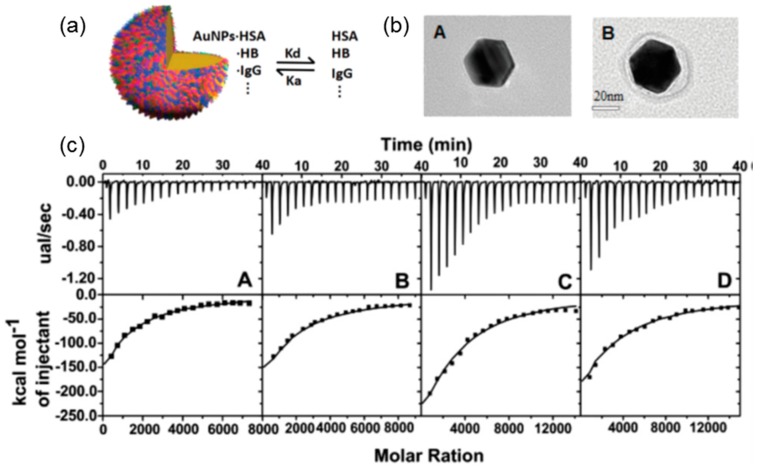
Figure 4.
(a) The schematic representation of plasma proteins’ adsorption and dissociation on an AuNP (b). The typical TEM image of a single AuNP (left) and its complex with plasma protein (right) (c). AuNP size dependence of ITC titration with plasma protein at 18 °C. From left to right, the average size of AuNP increased from 15 nm to 25 nm, 40 nm, and 70 nm. Figure 4 was taken and modified from the work of [54]. HAS—human serum albumin; HB—hemo-globin.

