Figure 1.

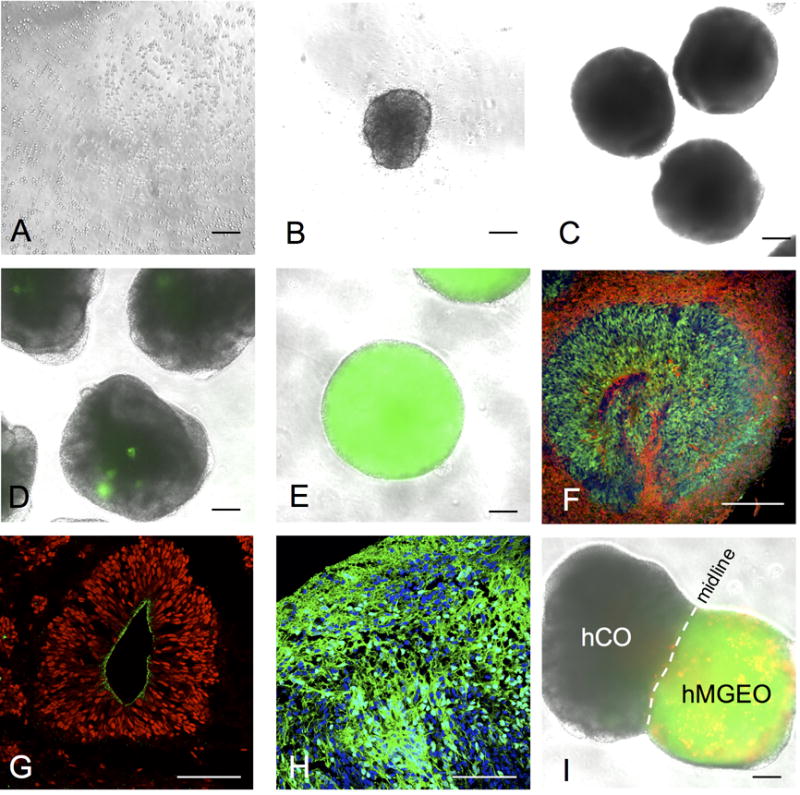
Different stages of human brain organoid culture. (A) Single cell suspension plated to ultra-low-attachment 96-well plate on day 0. (B) A EB formed in one well of ultra-low-attachment 96-well plate on day 1. (C) EBs transferred in to ultra-low-attachment 6-well plate on day 10. (D and E) On day 18, random clusters NKX2-1-GFP+ cells (green) are observed in hCOs (D), whereas hMGEOs typically show widespread NKX2-1-GFP+ cells (green) inside the organoids (E). (F) hCOs typically show PAX6+ (green) ventricular-like area and differentiated NeuN+ neurons (red) are located on the basal side. Image is from day 40 hCO cryosection. (G) SOX2+ cells (red) typically located in ventricular-like area in hCOs and the apical surface is N-cadherin+ (green). Image is from day 40 hCO cryosection. (H) NKX2-1+ cells (green) are typically enriched in hMGEOs. Image is from day 70 hMGEO cryosection. Scale bars in A-G represent 200 μm, and in H and L represent 100 μm. (I) Image of fused organoid 4 days after fusion. NKX2-1-GFP+ hMGEO was labeled with hSyn-RFP by lentivirus transduction before the fusion. Note some RFP+ cells already passed the midline at this stage. Scale bars represent 200 μm in A-E and I, and 100 μm in G and H.
