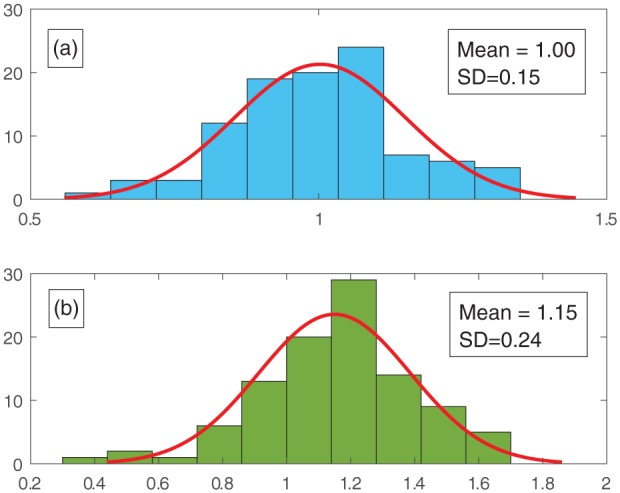
Figure 2.

A graph demonstrating how the model mimics experimental variability as explained in section ‘Adding a normal distribution function for the initial cell density’. (a) An example normal distribution of initial cell density, used in the simulations for material 2% CoO, is plotted and (b) the resulting distribution of final cell densities is shown. All values are normalised to N0 = 4.66 × 10⁸ cells/m2 corresponding to seeding with 15,000 cells. The final cell density shown here is taken after 1 day of simulated culture. A Shapiro–Wilk test (p > 0.1) was performed to confirm a normal distribution in the final cell number distribution (n = 100).
